 By Andrew Nyquist
The past six weeks have been an interesting ride full of crosscurrents and cautionary tales in the financial markets.
Rewind to the week of September 1o. The markets were rocketing higher, yet the AAII bulls vs bears poll was showing a virtual tie: 36.46 vs 32.99. Although some probably saw the relatively low number of bulls as a bullish indicator, I saw it as confusing. First and foremost, the markets had just moved 15% higher from the summer lows. Shouldn’t this number have read something like 45 or 50 percent bulls?
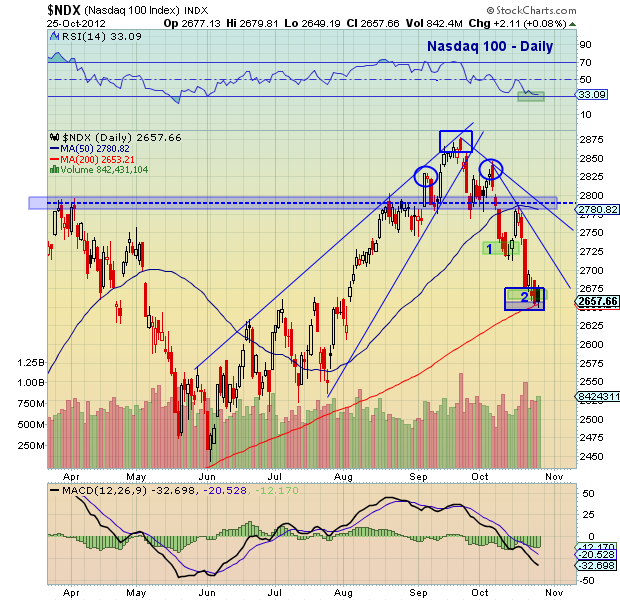
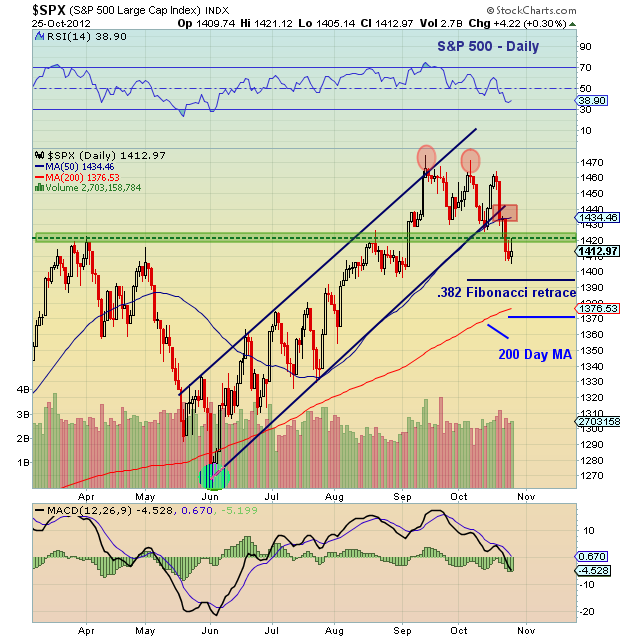
To me, uncertainty was seeping in. October was on the horizon, and future prospects of the presidential race and coming “fiscal cliff,” were beginning to weigh on the markets. The S&P 500 was working on a short term top that week, and just as important, the Nasdaq 100 put in its own top the following week (see charts below). As well, Mitt Romney caught the markets off guard by clearly winning the first debate; this charged the markets with emotion, but also forced participants to digest the prospect of change. And finally, tech leaders like Apple (AAPL) and Google (GOOG) began transitioning from smaller stock price pullbacks to larger corrections.
So here we are today. Many everyday active investors are confused and guessing based on their own sentiment/emotion. And it is in times like these that I find technical analysis to be the most helpful. After all, tuning out the noise and tuning into the price action allows us to get a much better read on psychology (price) than trying to directly analyze our own market emotions. So what are the markets telling us?
Let’s turn to the charts. Being that tech has really led the markets lower, let’s start there. As I cautioned about a couple weeks back, the Nasdaq 100 has dropped sharply lower out of a head and shoulders topping pattern. It is now coming into the targeted price zone for that pattern, as well as the 200 day moving average. Layer in an RSI of 33 and it appears the index may be nearing a tradable bottom. But I still believe caution is warranted, as the index has more or less stalled at this level and needs to show some follow through to the upside. One possibility may be for a quick washout below the 200 day moving average. If lower, watch the 2600 level.
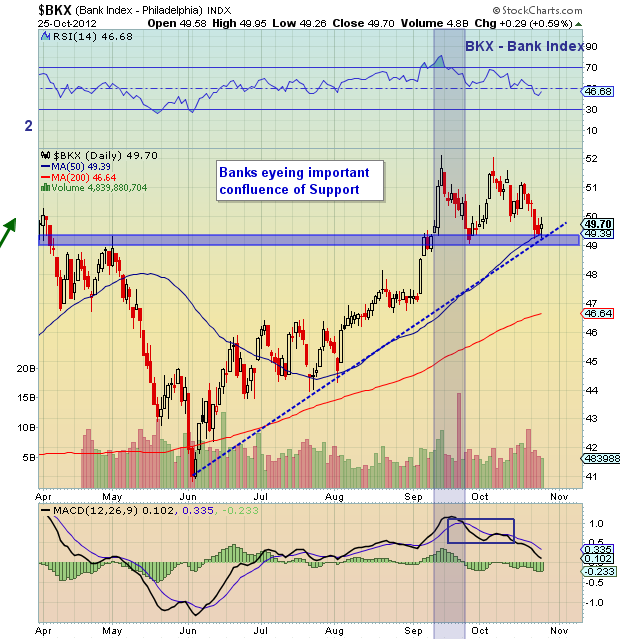
The S&P 500 shows two topping tails followed by downside action that cut through uptrend support, the 50 day moving average, and the 1420 support level. A precursor to this action was the strength in Utilities and general weakness in small cap and beta stocks (for more, read “Defensives Up, Small Caps Down, and Risk Flatlining“). The next lower support level resides at the 38.2% Fibonacci retracement level (1394). If this level can hold, the index may have a shot at the 1420 level again. A sustained move below 1390 would target the 200 day moving average and 50% Fibonacci support around 1370. I ‘ve added a chart of the Bank Index as well. It’s teetering near important support and a lift from the piggies would be constructive for a bounce.
———————————————————
Twitter: @andrewnyquist and @seeitmarket Facebook: See It Market
Author has a position in S&P 500 related SPY and Nasdaq 1oo related QQQ at the time of publication.
Any opinions expressed herein are solely those of the author, and do not in any way represent the views or opinions of his employer or any other person or entity.


