 By Andrew Nyquist
Last weekend I penned a technical piece “Watch the Banks” and wrote the following:
“After topping with other major market indices on Friday September 14th, the Bank Index (BKX) pulled back over 5% to lateral support… before rallying again. However, this past Friday (just 3 weeks later), the index produced another topping tail at the same identical spot.”
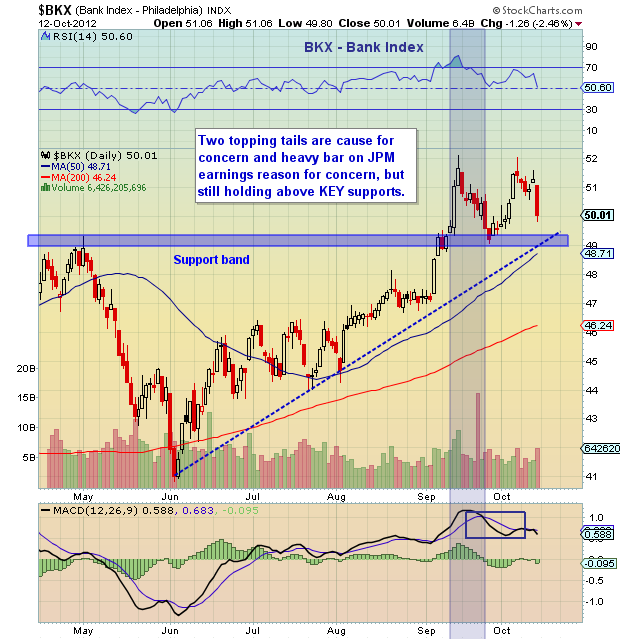
Well, so far so bad. What? Yeah, the financials traded lower after JPMorgan (JPM) and Wells Fargo (WFC) earnings. Probably a bit to do with the Spain downgrade as well. Either way, the banks are nearing a confluence of key support: 1) Lateral support 2) Uptrend support 3) Double top neck line support 4) 50 day moving average.
As well, the RSI is starting to turn lower after a period of indecision. The banks need to firm up soon or risk another week of softness. Keep an eye on key upcoming earnings from Citigroup, Inc. (C) on 10/15, Goldman Sachs on 10/16, Bank of America (BAC) on 10/17, and Morgan Stanley on 10/18. We should know more by end of week. For the bank index, watch the key supports mentioned above.
Trade safe, trade disciplined.
More charts found here.
Bank Index (BKX) chart as of October 12, 2012. Bank index price chart with technical support and resistance. Bank stocks technical analysis.
———————————————————
Twitter: @andrewnyquist and @seeitmarket Facebook: See It Market
No position in any of the securities mentioned at the time of publication.
Any opinions expressed herein are solely those of the author, and do not in any way represent the views or opinions of his employer or any other person or entity.


