 By Andrew Nyquist
The banks have been a big part of the summer rally, reminding us of the days of yore (sarcasm) when the banks would lead. That said, they’ve also been a bit lumpy over the past year and a half due to the global slowdown, regulatory uncertainty, and the European crisis.
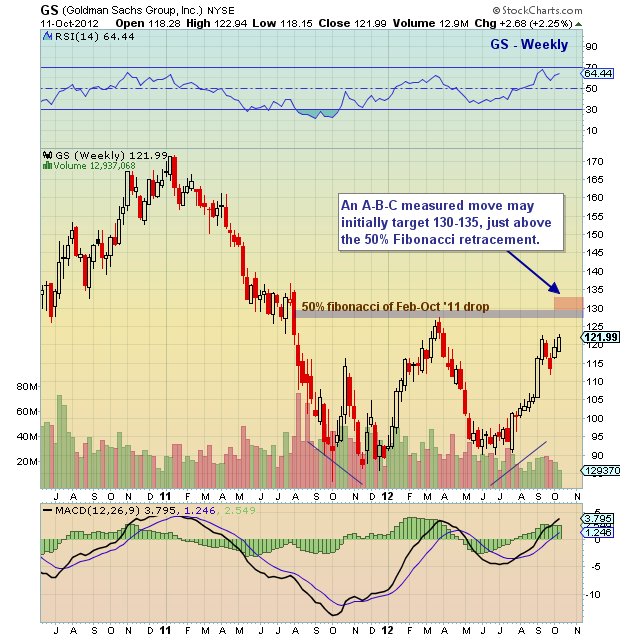
One bank that has fared well as of late, and risen +35% since July is Goldman Sachs (GS). The chart below highlights the 50 percent Fibonacci level for the 2011 drop, as well as a measured move target. But, let’s face it, much of the action above that level will be dictated by the overall markets ability to charge to new highs. Either way, though, I would expect these levels to act as magnets. Note that the chart below is weekly (so a bit wider lens and time horizon).
Trade safe, trade disciplined.
More charts found here.
Goldman Sachs (GS) chart as of October 11, 2012. Goldman Sachs price chart with technical support and resistance and Fibonacci retracement levels. GS technical analysis.
———————————————————
Twitter: @andrewnyquist and @seeitmarket Facebook: See It Market
No position in any of the securities mentioned at the time of publication.
Any opinions expressed herein are solely those of the author, and do not in any way represent the views or opinions of his employer or any other person or entity.


