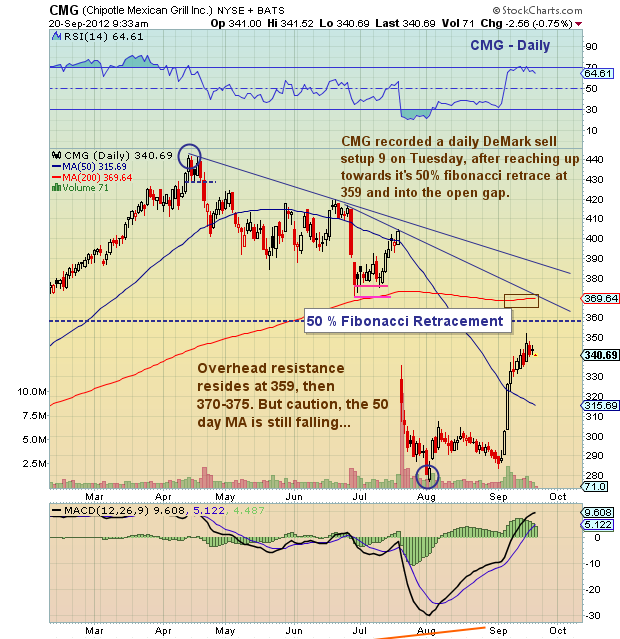
 After forming a 5 week base, Chipotle (CMG) surged higher, retracing close to 50 percent of its April to August downdraft.
This surge also ended with a daily DeMark sell setup, a sign of near term exhaustion. As such, the stock has been pulling in over the past few sessions. Trying to gauge whether this is simple consolidation or a top and drop scenario can be difficult, so watch the character of the price action over the coming days (volume, indicators, candles, formation, etc…).
Technically speaking, and from a macro perspective, CMG likely needs more time to back and fill and consolidate. As well, the stock is still working off overbought signals and the 50 day moving average has yet to turn up. If long, remember to have a plan and define your risk. On the upside, layered resistance resides at 359 and 375.
Trade safe, trade disciplined.
Previous CMG Chartology here.
More Charts here.
Chipotle (CMG) stock chart as of September 19, 2012. CMG technical support and resistance levels with fibonacci retracements. CMG technical analysis and DeMark daily 9 sell setup.
———————————————————
Twitter: @andrewnyquist and @seeitmarket Facebook: See It Market
No position in any of the securities mentioned at the time of publication.
Any opinions expressed herein are solely those of the author, and do not in any way represent the views or opinions of his employer or any other person or entity.


