Over the last three weeks the gold story has reasserted itself as the top story of the global capital markets. Since the August 20 close, SPDR Gold Shares (GLD) has rallied just over 11 points. The breakout follows two consecutive inside months in June and July of this year. Historical precedent and seasonality suggest that Gold will continue its move higher in the weeks ahead.
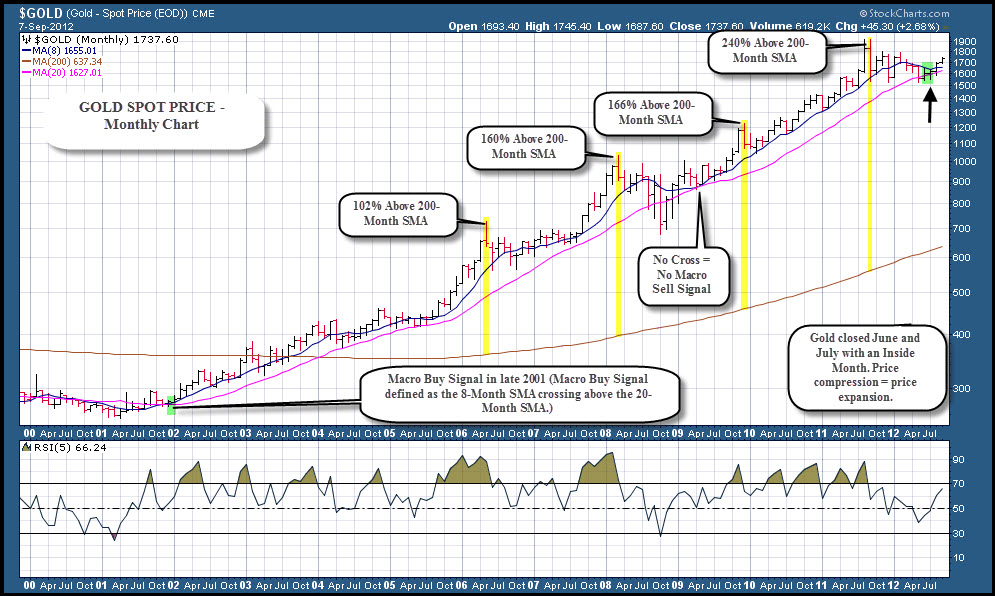
GOLD – SPOT (Monthly Chart)
The decline of Gold from the September 2011 high to the May 2012 low was in reaction to an extreme deviation from the 200-month SMA, both on an absolute and relative basis. However, during the pullback Gold held the secular uptrend.
The tip-off of an impulsive move in Gold was the two consecutive Inside Months in June and July of this year. It is often said that price compression leads to price expansion and in this case, the price expansion has been to the upside.
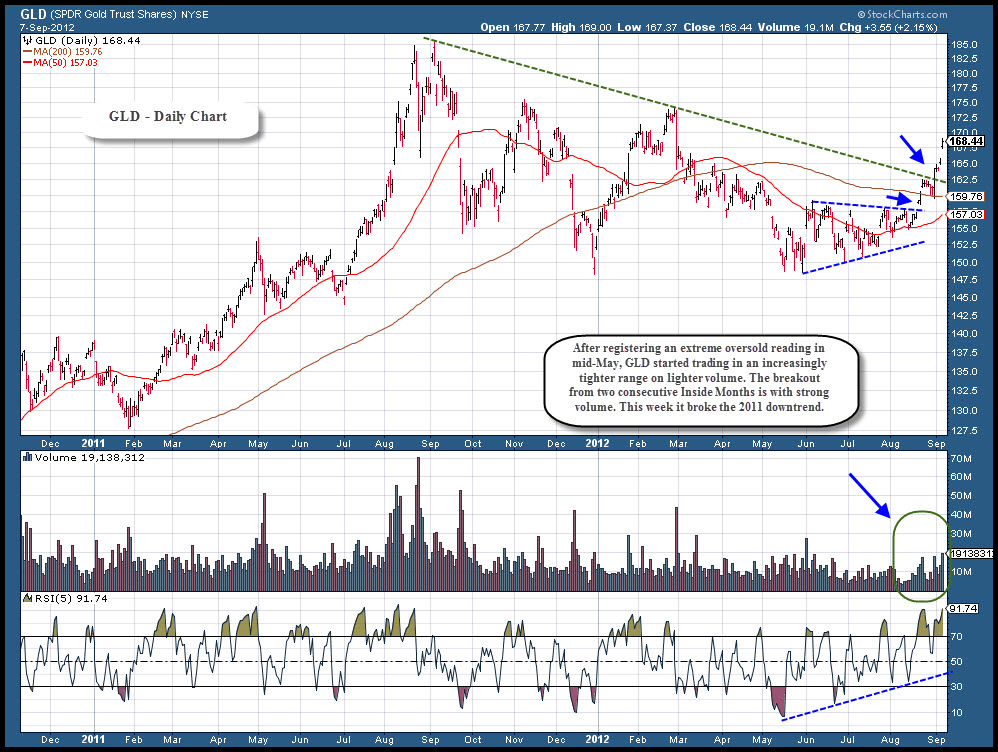
GLD (Daily Chart)
The daily chart of GLD highlights the bullishness of the breakout.
The rally above the 200-day SMA was supported by a burst of volume. The small, brief drift back to the 200-day SMA was on light volume and then the push above the 2011 trendline was once again supported by strong volume.
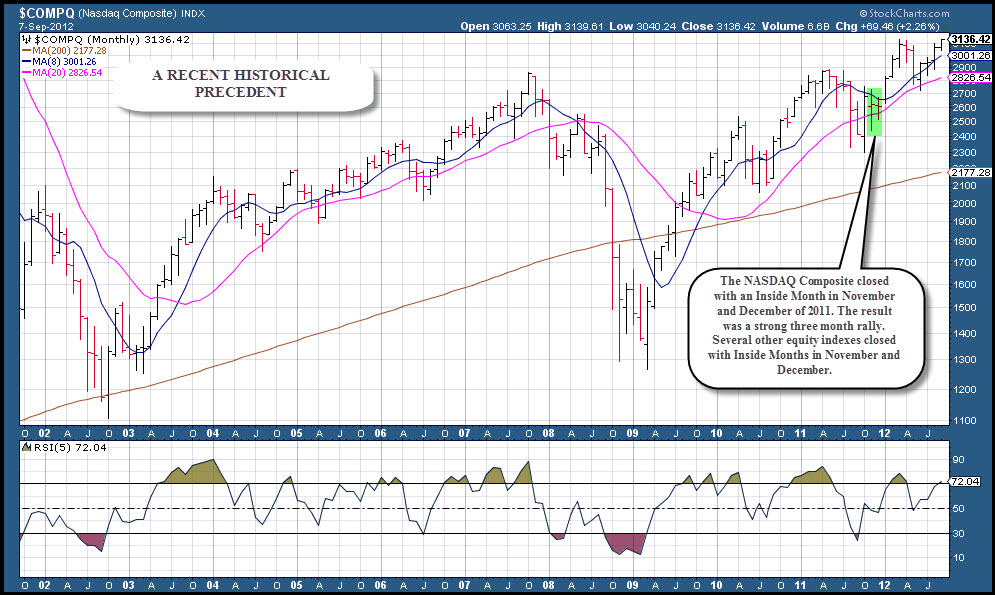
Recent Historical Precedent – NASDAQ Composite Index (Monthly Chart)
A recent historical precedent for Gold is the NASDAQ Composite Index. In November and December of 2011 the NASDAQ Composite Index closed with two consecutive Inside Months (The S&P 500, NYSE, NASDAQ 100 and S&P Mid-cap 400 also closed with Inside Months). During the consolidation process the long-term bull signal remained active and the index held the uptrend.
The period of price compression translated into a strong move to the upside in the first quarter of 2012 and based on my working thesis for the U.S. equity markets it is the beginning of a major leg for the equity bull market.
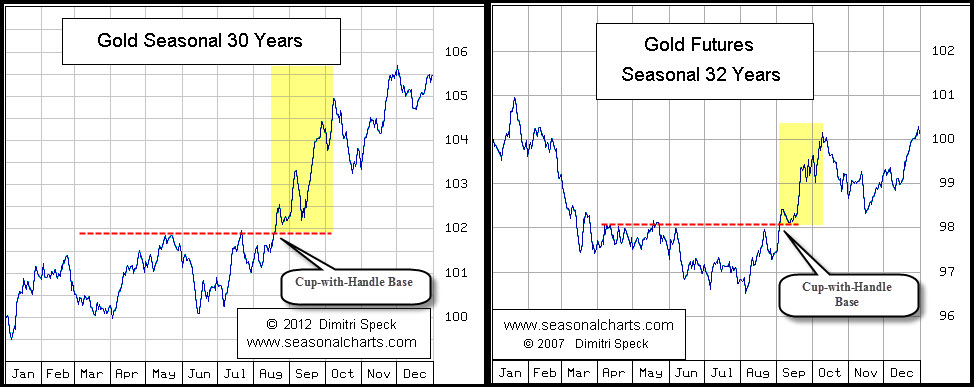
Seasonality – Gold Spot and Gold Futures
Gold is entering a strong period in terms of seasonality. The charts below show the historical tendency of gold to consolidate in the April to August period before breaking out from a Cup-with-Handle base. The initial moves are usually impulsive.
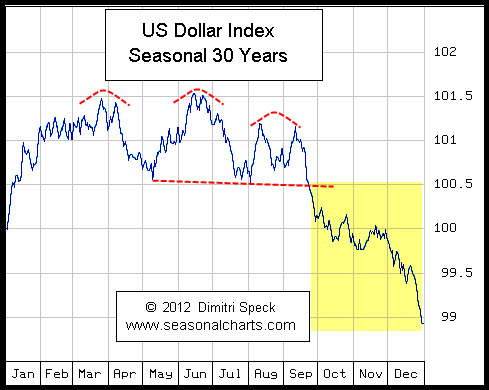
The seasonality of the U.S. Dollar Index also supports a positive outlook for gold in the coming weeks.
Moving forward, I see the breakout in Gold gaining traction and it should at least test the bull market highs of 2011. The extreme deviation of Gold from the 200-month SMA in 2011 does offer caution and may signal that any new high for the bull market is short lived.
In the short-term, Gold is overbought and will likely see a small correction in price or time in the coming days. If the small correction evolves into move below the 200-day SMA we need to entertain the idea that the 2011 high was the end of the secular bull in Gold.
—————————————————————-
Twitter: @hertcapital @seeitmarket Facebook: See It Market
The author has a position in ProShares Ultra Gold (UGL).
Any opinions expressed herein are solely those of the author and do not in any way represent the views or opinions of any other person or entity.

