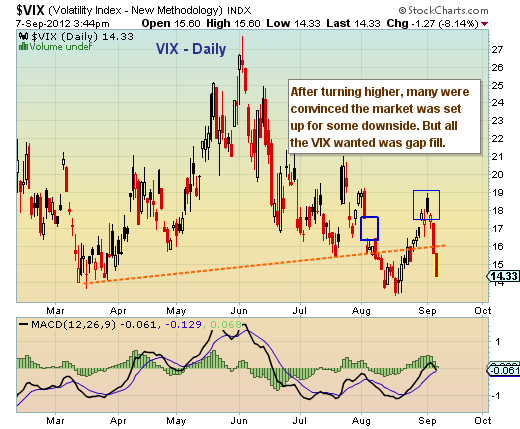
 After creeping higher for much of the back half of August, the Volatility Index (VIX) reversed lower on Tuesday and kept going… nearly 5 points lower in 4 days. And with that, we have an equity breakout and new highs on the year.
That said, this breakdown looks sharp and fast, similar to the March drop that led to Spring equity highs/topping pattern. Enjoy the ride, but remember to trade with discipline.
More charts found here.
Volatility Index (VIX) chart with technical analysis overlay as of September 7, 2012. VIX chart with trend lines and technical support levels. VIX technical analysis. VIX – volatility index.
———————————————————
Twitter: @andrewnyquist and @seeitmarket Facebook: See It Market
No position in any of the securities mentioned at the time of publication.
Any opinions expressed herein are solely those of the author, and do not in any way represent the views or opinions of his employer or any other person or entity.


