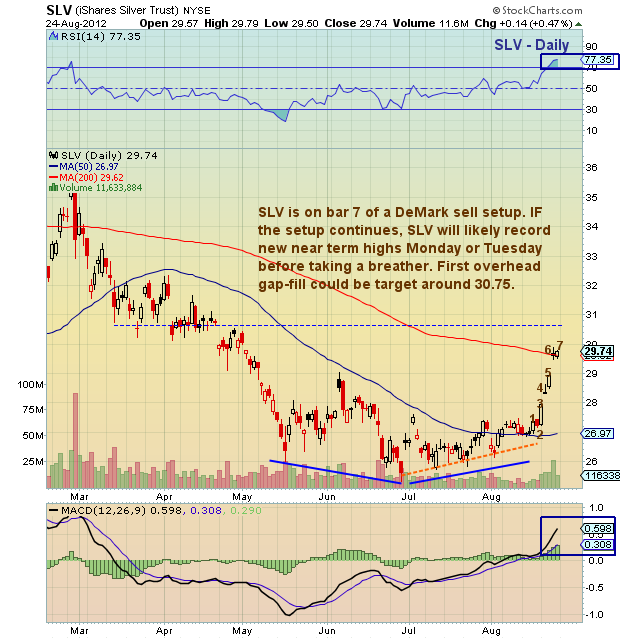
 After forming a three month base, iShares Silver (SLV) broke out above resistance to new short term highs (see previous chartology on Silver). The move higher is currently on bar 7 of a daily DeMark sell setup that may allow it to run a bit higher into Monday or Tuesday before consolidating. Note that 30.75 is an overhead gap magnet.
SLV is nearing short term overbought conditions, yet still quite strong on the daily chart.
More charts found here.
Silver iShares (SLV) chart with technical analysis overlay as of August 24, 2012. SLV Price support and resistance levels with DeMark analysis. SLV chart with trend lines and technical support levels. SLV technical analysis. Silver – precious metals.
Twitter: @andrewnyquist and @seeitmarket Facebook: See It Market
No position in any of the securities mentioned at the time of publication.
Any opinions expressed herein are solely those of the author, and do not in any way represent the views or opinions of his employer or any other person or entity.


