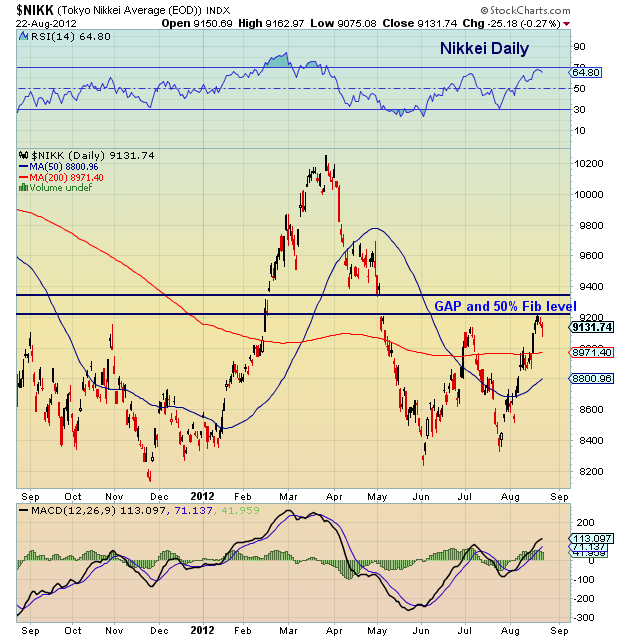
 Tokyo’s Nikkei 225 stock market index is nearing an interesting band of resistance comprised of the early May gap lower and the 50 percent fibonacci retracement of the the March to June stock swoon.
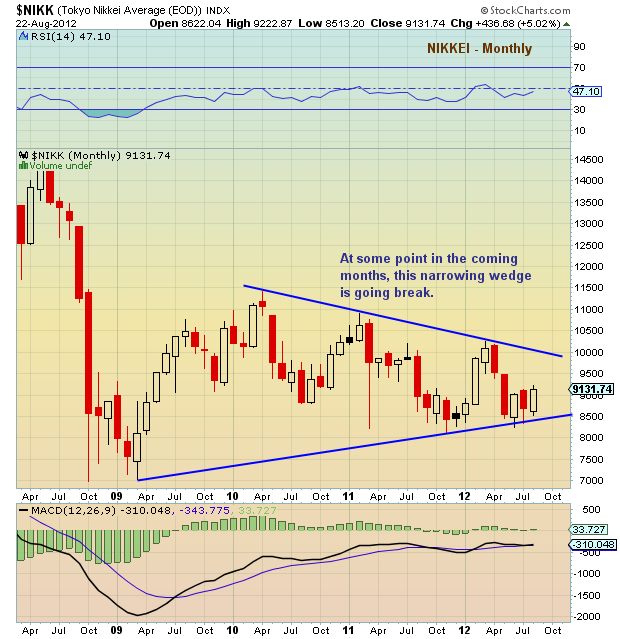
Longer term, the index is in a narrowing wedge that should bring the start of a bigger move in the next 3-6 months.
More charts found here.
Nikkei stock market charts as of August 22, 2012. Nikkei charts with trend lines and technical support levels. Tokyo stock market. Nikkei technical analysis.
———————————————————
Twitter: @andrewnyquist and @seeitmarket Facebook: See It Market
No position in any of the securities mentioned at the time of publication.
Any opinions expressed herein are solely those of the author, and do not in any way represent the views or opinions of his employer or any other person or entity.


