Nearly every day that the financial markets are open, you can catch a series of interesting stock market charts on See It Market’s Twitter stream. Today we looked at a handful of stocks and market indicators.
Below you’ll see a short-term indicators for the S&P 500 ETF (NYSEARCA:SPY), investor sentiment and market breadth indicators, and stock charts for names like Starbucks (NASDAQ:SBUX), Boeing (NYSE:BA) and more.
Please share your ideas and any key charts you are watching with us. Just comment below or tweet us @seeitmarket.
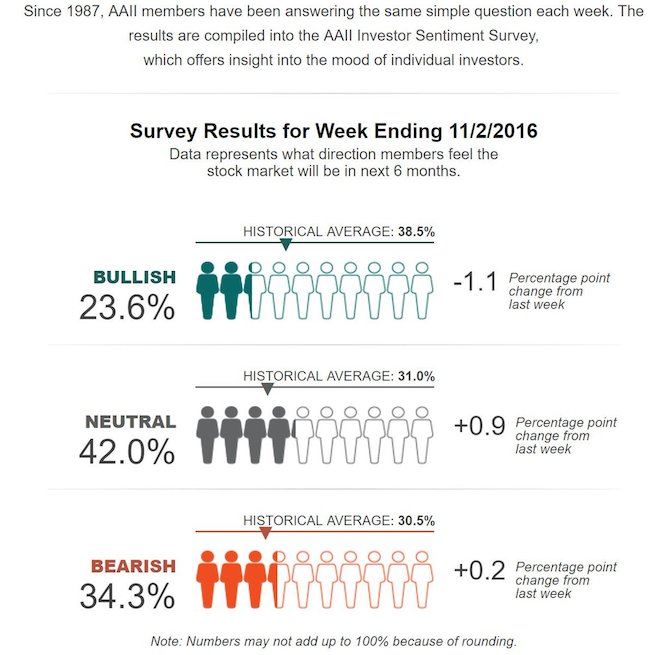
1). Investor Sentiment has been in gutter for a while now. Actually, sentiment has been less bullish than historical average for over a year now. Will this ultimately be a contrarian indicator?
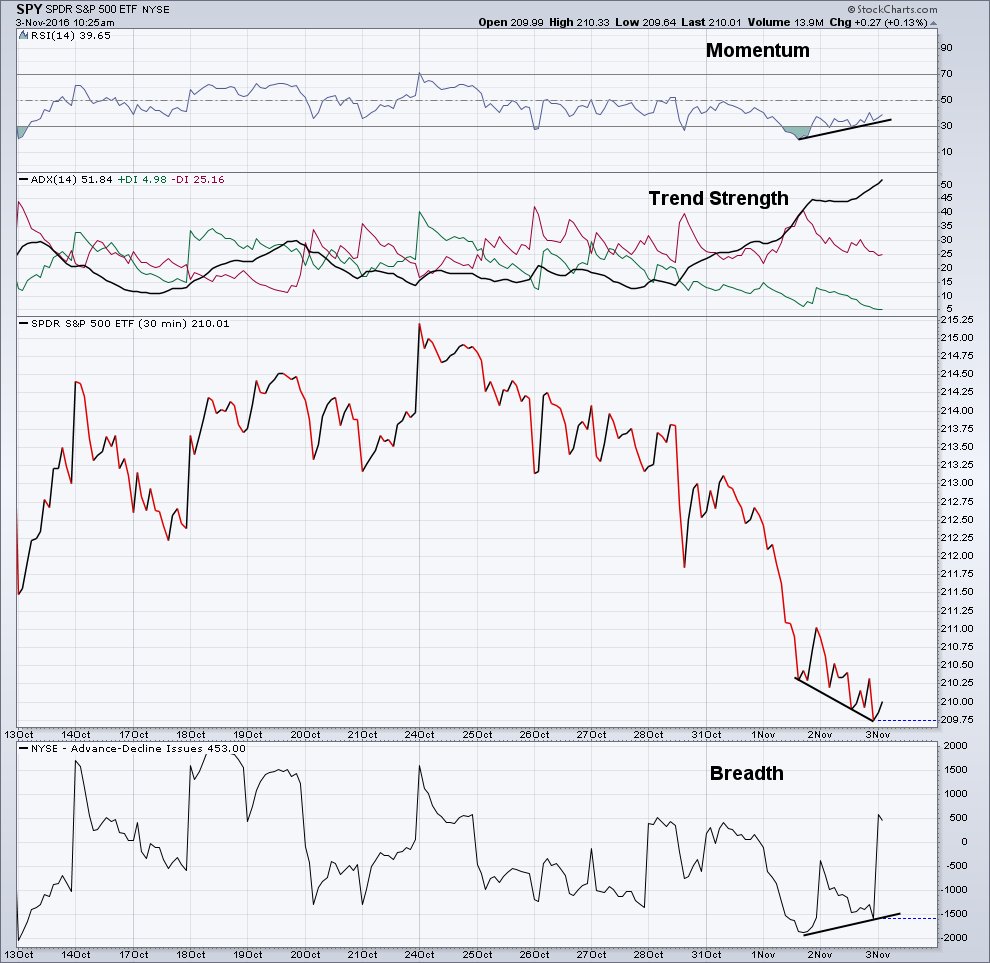
2). A bullish momentum divergence is forming on the S&P 500. This chart comes from @AndrewThrasher.
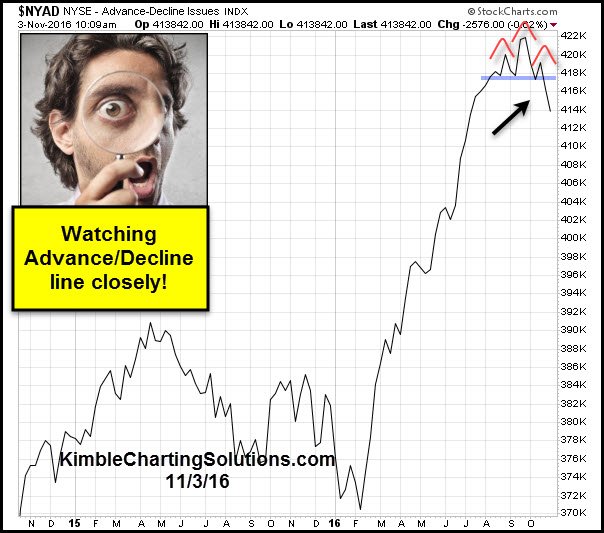
3). The NYSE Advance/Decline Line has formed a bearish chart pattern. Chart from @KimbleCharting.
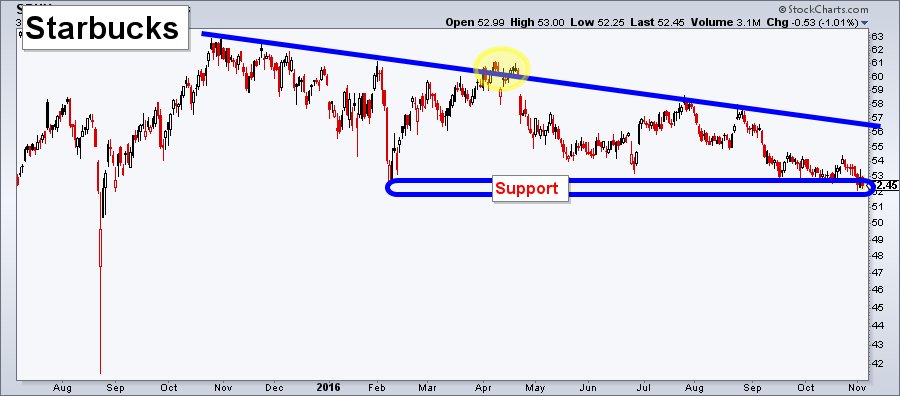
4). Starbucks stock is sitting on important price support into tonight’s earnings report.
continue on the next page…

 Trying to Bottom?")
 Is Telling Broader Stock Market?")


 Is Telling Broader Stock Market?")
 Trying to Bottom?")