The US Financial Markets are closed Friday but it’s important to relay a 5 things to watch.
First, the first move off early week lows looks to be near initial resistance for the S&P 500 Index. However, dips should prove short-lived and buyable.
Second, the defensive trading that ruled this past week doesn’t look that important as a negative just yet, as breadth was largely very good all week.
Third, Emerging markets look to be coming alive as the breakout in relative terms vs Developed is a very constructive sign for this space, just as the NASDAQ 100 (NDX) has reached a minor upside target.
Overall, it doesn’t look wrong for traders to shift out of Nasdaq 100 and into Emerging Markets (EEM) and/or the China ETF (FXI).
Fourth, the precious metals trade should remain an area of focus in July as little to no real damage has occurred and charts remain bullish of silver, gold and precious metals stocks.
Fifth, signs of triangle consolidations are being exceeded globally not just in the US. We’ve seen some good catchup in S&P 500 Index (SPX) , Dow Jones Industrials (DJIA) in the US, while EEM has made precisely the same move on Thursday July 2.
Thus, it’s right to use any pullback one is given to still put money to work here, and it’s thought that the next two weeks should be positive and markets should continue to advance.
Selloffs, which are entirely possible on a 2-3 day basis, should prove short-lived and buyable.
Chart Spotlight: Nasdaq 100 (NDX)

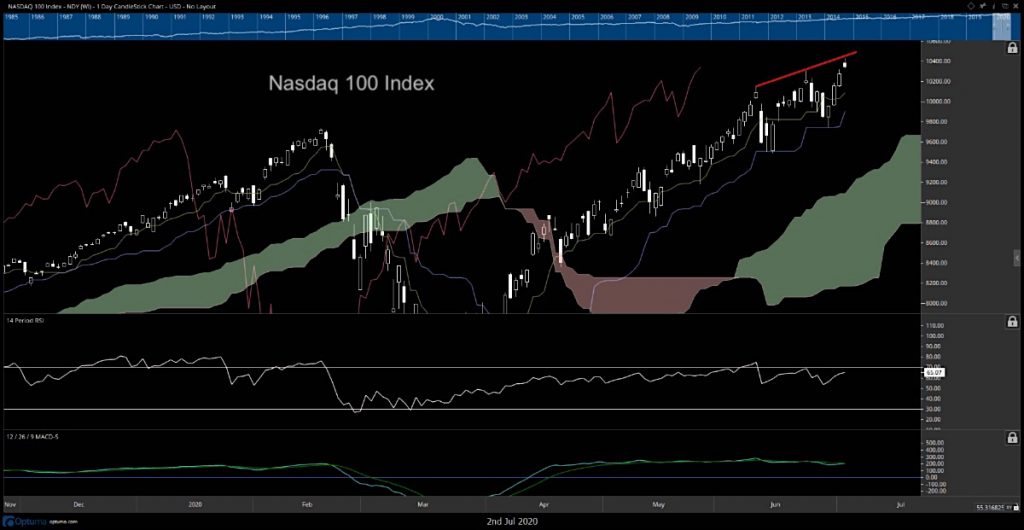
This daily Optuma chart of the NASDAQ 100 shows prices right up against a decent area of resistance after this rally over 10k. The area at 10450-10550 should contain prices in the short run and could result in a minor pullback this coming week.
Linda Bradford Raschke (I believe) made this pattern famous calling it “Three Little Indians” with successive higher peaks leading to a short-term top. However, the structure overall is bullish, and I don’t expect weakness should undercut this past week’s lows before pushing ever higher.
While equal-weight Tech remains far more subdued than the NASDAQ, for now, it’s just tough to fight the trend for anything more than a few days time. Key timeframes of importance lie at 7/16 and then the following 7/23-5, while 8/19 also has quite a bit of significance, being 180 days from our February peak.
Have a great July 4th for those celebrating.
If you have an interest in seeing timely intra-day market updates on my private twitter feed, please follow @NewtonAdvisors. Also, feel free to send me an email at info@newtonadvisor.com regarding how my Technical work can add alpha to your portfolio management process.
Twitter: @MarkNewtonCMT
Author has positions in mentioned securities at the time of publication. Any opinions expressed herein are solely those of the author, and do not in any way represent the views or opinions of any other person or entity.


