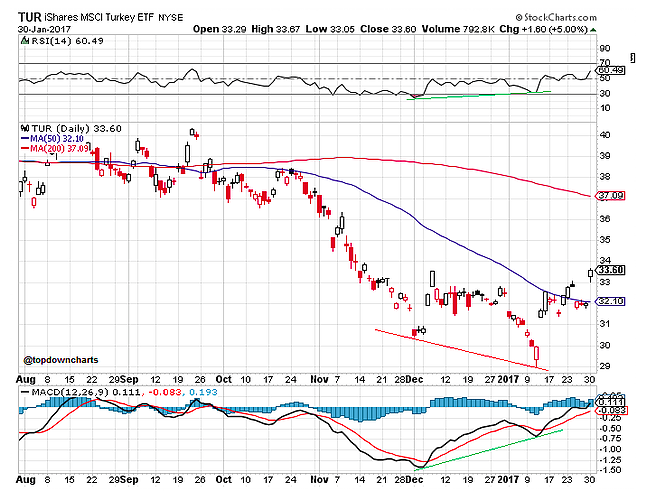
Turkey – Bullish divergence
The bullish divergence suggests the bottom is in for Turkish equities (TUR). Lower lows on the price and higher lows on RSI and MACD (classic bullish divergence). The ETF’s price has also just broken through the 50 day moving average, potentially opening up a move towards the 200 day moving average (resistance around 37).
Overall technical view: Bullish (risk management is a break back below 50dma and support of 32)
Thanks for reading.
Twitter: @Callum_Thomas
Any opinions expressed herein are solely those of the author, and do not in any way represent the views or opinions of any other person or entity.


