July 2016 is in the books and it will go down as the official month that the S&P 500 Index (INDEXSP:.INX) broke out from its 16+ month range to new all time highs.
That said, even though the S&P 500 gets most of the attention, the Nasdaq and Russell were the real winners, returning nearly twice as much as the S&P 500.
July Monthly Returns
+3.56% S&P 500
+6.60% Nasdaq Composite
+5.90% Russell 2000
Looking ahead to August, and keeping an eye on the peculiarly tight range we’ve traded within over the past two weeks, there’s a few indicators that have my attention… and a few bullish stock charts (further below)
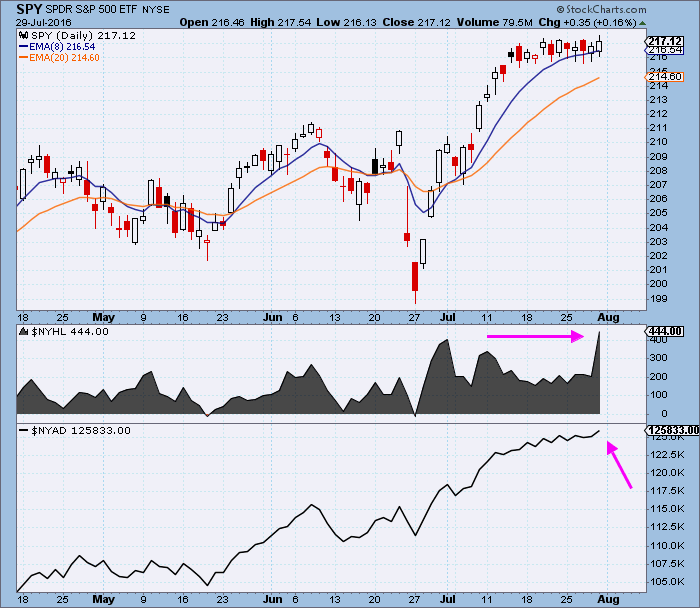
The first is the $NYHL, which is displayed below the SPY price action on this chart and is tracking the number of stocks making new highs minus new lows in the NYSE. Notice on Friday we saw an expansion of new highs to the highest levels we’ve seen all year.
The $NYAD at the bottom, is a cumulative look at the advance decline line. Notice here it is still out in front of the SPY price action, leading to new highs.
Both of these readings of the general market’s health continue to support the bull thesis over the intermediate to long term time horizon (short term, price action is up for grabs and could remain choppy).
Aligning with our bullish intermediate to long term thesis, have a look at these 5 stocks that are in the process of emerging from actionable bases. Make note that these 5 bullish stock charts are presented on monthly and weekly time-frames.
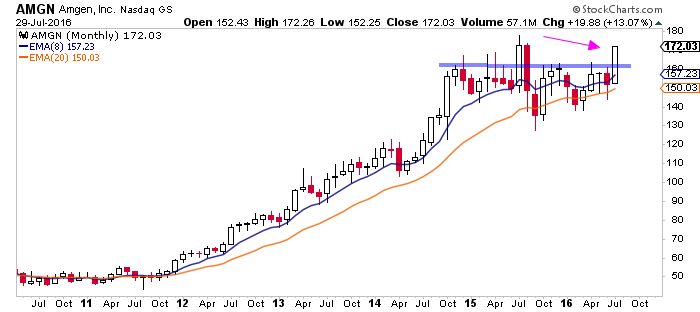
Amgen (NASDAQ:AMGN) Stock Chart Setup
AMGN despite it’s 13% rally this month, it’s just potentially getting started with this breakout move out of a 20 month base. New all time highs look to be on deck.
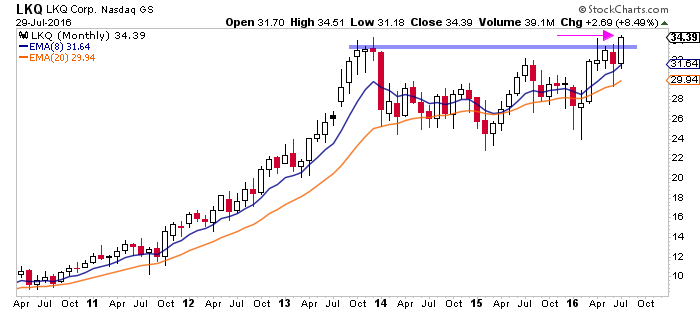
LKQ Corporation (NASDAQ:LKQ) Stock Chart Setups
LKQ this is a name members and I got long recently after seeing this emerge to new all time highs from a multi year consolidation pattern.
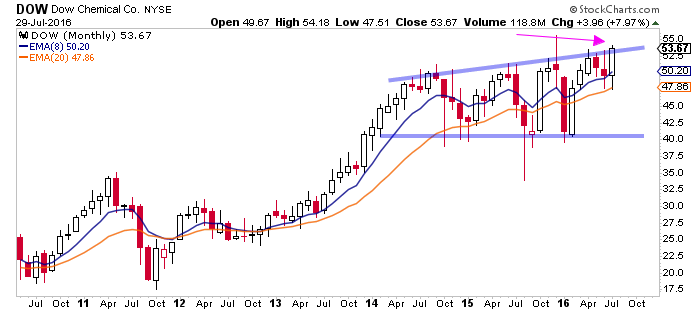
Dow Chemical (NYSE:DOW) Stock Chart Setup
DOW here’s one that hasn’t convincingly broken out just yet, but it’s awfully close. This 53 level stretches back as resistance all the way to 2005. Keep it on watch.
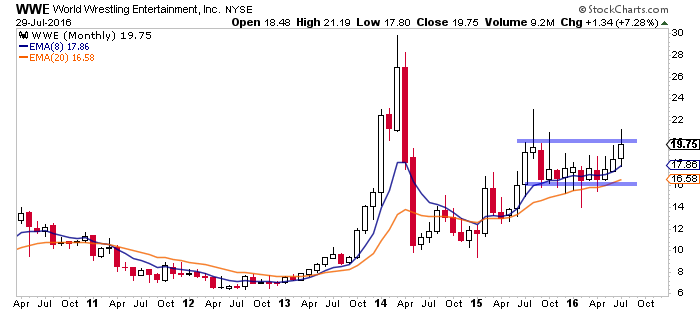
World Wrestling Entertainment (NYSE:WWE) Stock Chart Setup
WWE isn’t anywhere near all time highs but it is starting to emerge nicely from a year long consolidation pattern. If it can start to clear and hold above 21, it looks good for more.
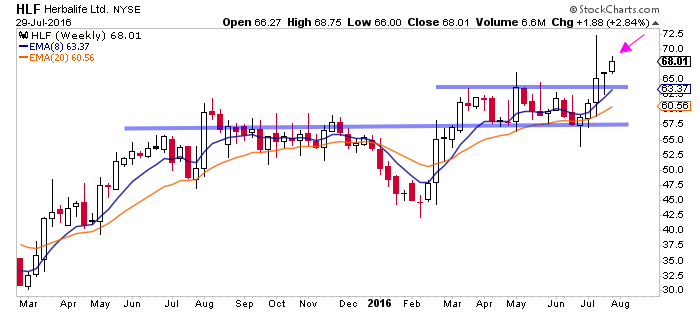
Herbalife (NYSE:HLF) Stock Chart Setups
HLF looking at a weekly chart here we can see this continues to stair step and break it’s way higher. Looks good for more.
I hope you find these bullish stock charts (setups) and market context useful during the heat of summer. Good luck out there!
Twitter: @EvanMedeiros
The author is long LKQ at the time of publication. Any opinions expressed herein are solely those of the author, and do not in any way represent the views or opinions of any other person or entity.

