I am a linear thinker. I like indicators that show conditions of the stock market.
For today, I picked four stock market indicators that should help guide us on the next moves in the market.
And please note, it must last longer than an intraday move, or a daily move. We need to see a pattern.
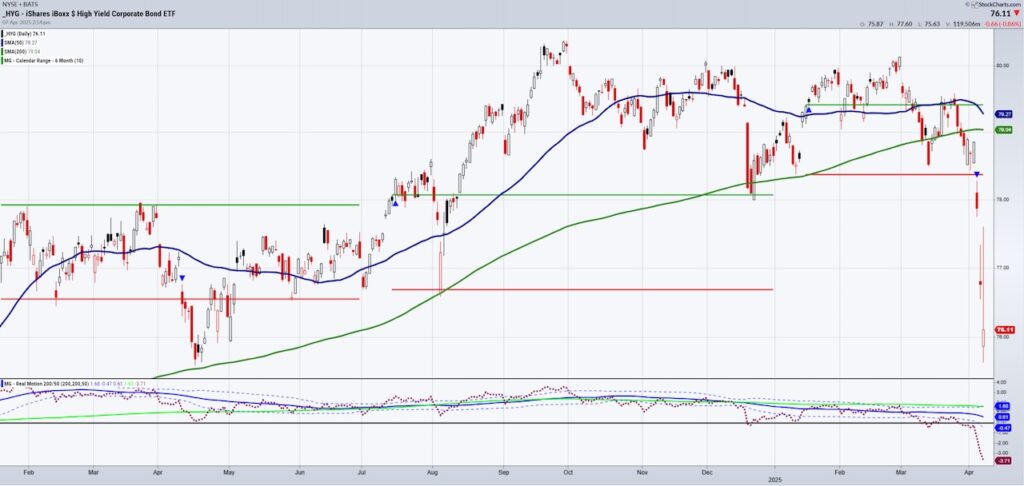
- High Yield Bonds (HYG) settles down
Junk bonds are a constant topic in my universe of indicators. Not only to measure risk (currently risk off) but also to measure appetite for low balance sheet, high paying yield companies.
In 2020, HYG flashed the warning before the market did.
Now, the move lower was dizzying. However, 75-76 is support.
Under 75, I would get even more defensive.
Over 77, I would start thinking about buying equities.
2. Growth stocks starts to outpace value stocks
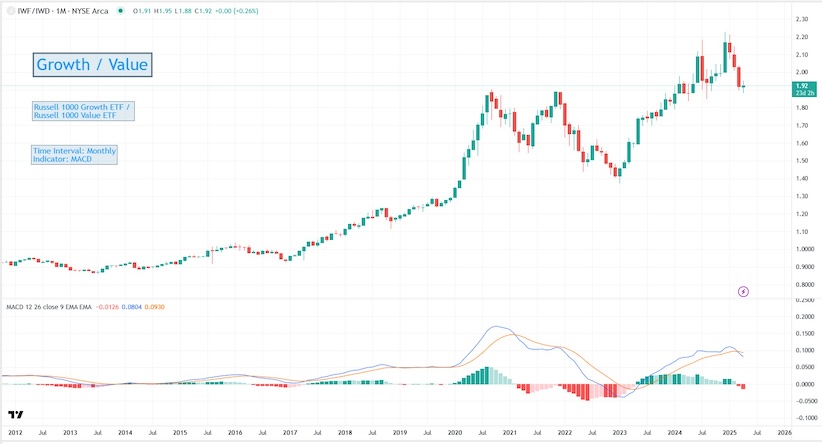
Every rally we have had for a long time started with buying in the growth stocks. Call it tech, semiconductors, or MAG7, they have led or as in the case of last year, lagged.
Growth caught a bid today. However, the bounce is meager and needs to prove more.
3. Retail Sector (XRT) or consumer sector stabilizes
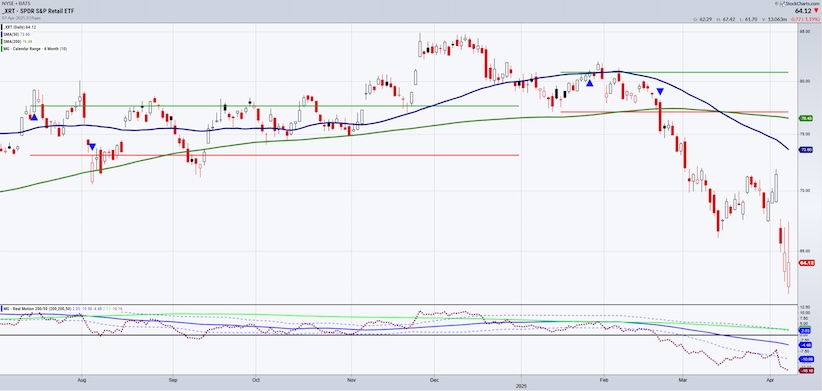
I hope most of you know by now about my Granny Retail indicator.
As 70% of the GDP, XRT reflects fears about a few issues besides tariffs. Debt, geopolitics, inflation, recession, and savings are a few of the consumer’s list of worries.
XRT began selling off in January. Now, it has crashed.
It must stabilize and tell us that the consumer has gone from extreme worry, to it’s not so bad.
The chart needs to see a move at least, above 65.
Lastly, people want to see lower interest rates.
But is that such a great thing?
4. Federal Funds remain above 3.75%
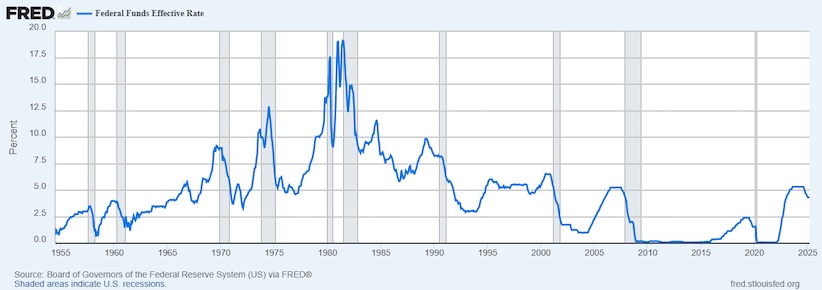
During periods of economic growth, the Federal Funds rate remains flat or rises.
During the 1960s, they rose.
During the dot.com bubble, financial crisis and Covid, they fell.
We like them around 4% but note that they have turned down this month.
They turn during recessions. Just look at the shaded areas.
We are not there yet but watch I would be concerned if they break under 3.5%.
Let’s check…
Junk bonds calmed down-NO
Growth is outpacing Value- not in a sustainable fashion right now
Retail has found a bottom- NOT YET
Fed Funds are stable- MAYBE
Twitter: @marketminute
The author may have a position in mentioned securities at the time of publication. Any opinions expressed herein are solely those of the author and do not represent the views or opinions of any other person or entity.
 Nearing A Bottom?")

?")
?")


