With the markets posting another year of solid gains, many investors relaxed heading into December. After all, the setup for December seemed to be ‘piece of cake’ with underperforming investors chasing returns into year-end, portfolio managers adding some dressing, and the impending Santa Claus rally.
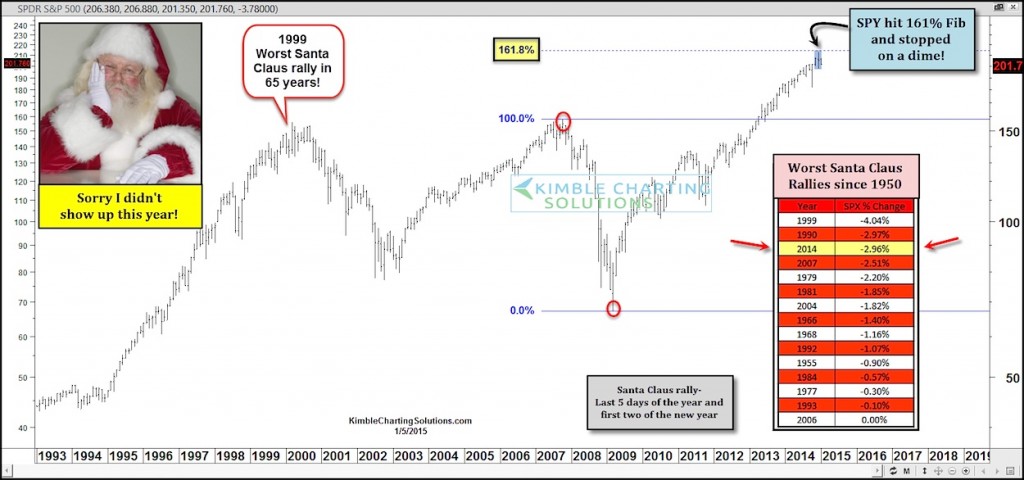
But what investors received was an increase in volatility and a not so “ho ho ho” happy Santa. The Santa Claus rally (defined as the last 5 trading days of the year and the first 2 trading days of the new year) was not so friendly. In fact, this year’s Santa Claus period was the 3rd worst performing since 1950, coming in behind 1990 and 1999, and just ahead of 2007 – not great company! Perhaps another reason to stay focused on risk management in 2015.
Also note that the SPDR S&P 500 (SPY – Quote) recently hit its 1.618% Fib Extension. In the process of doing this, it put in a weekly doji star reversal candle. This combination likely makes this resistance level an important one to watch in the weeks ahead.
SPDR S&P 500 Chart – Santa Claus Rally “No-Shows”
Thanks for reading.
Follow Chris on Twitter: @KimbleCharting
No position in any of the mentioned securities at the time of publication. Any opinions expressed herein are solely those of the author, and do not in any way represent the views or opinions of any other person or entity.


