Over the past few decades, the U.S. Dollar has been weakening.
Could this weakness be coming to an end?
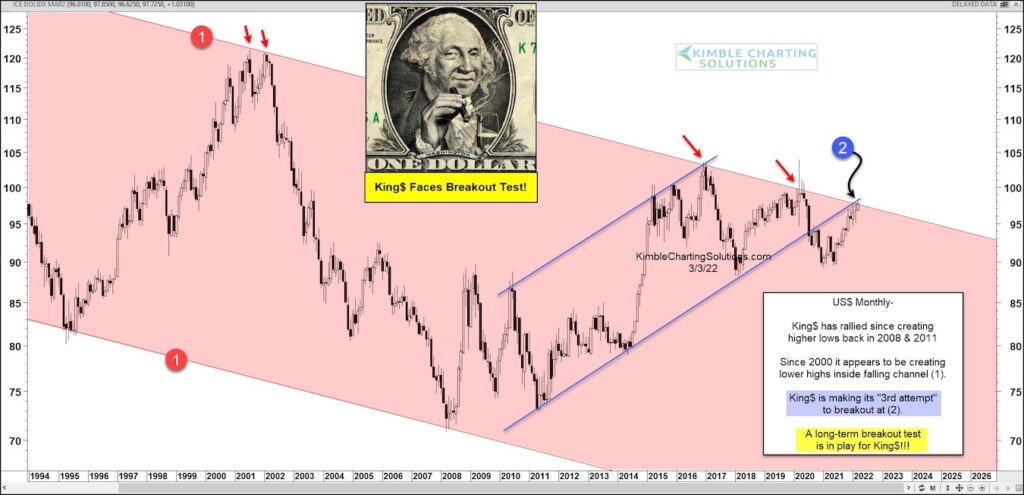
Today’s long-term “monthly” chart highlights an important test for the U.S. Dollar… and the global financial complex!
Here you can see King Dollar has been in a falling channel marked by each (1). The Dollar has continued to make lower highs and that has held any concerns in check… until now.
As you can see, the Dollar has created higher lows since 2008 and failed to break out of the falling channel on two other occasions. Will the third time be the charm at (2)?
A long-term breakout would add a wrinkle to the entire financial complex. This is a big test. Stay tuned!
U.S. Dollar Index “monthly” Chart

Note that KimbleCharting is offering a 2 week Free trial to See It Market readers. Just send me an email to services@kimblechartingsolutions.com for details to get set up.
Twitter: @KimbleCharting
Any opinions expressed herein are solely those of the author, and do not in any way represent the views or opinions of any other person or entity.


