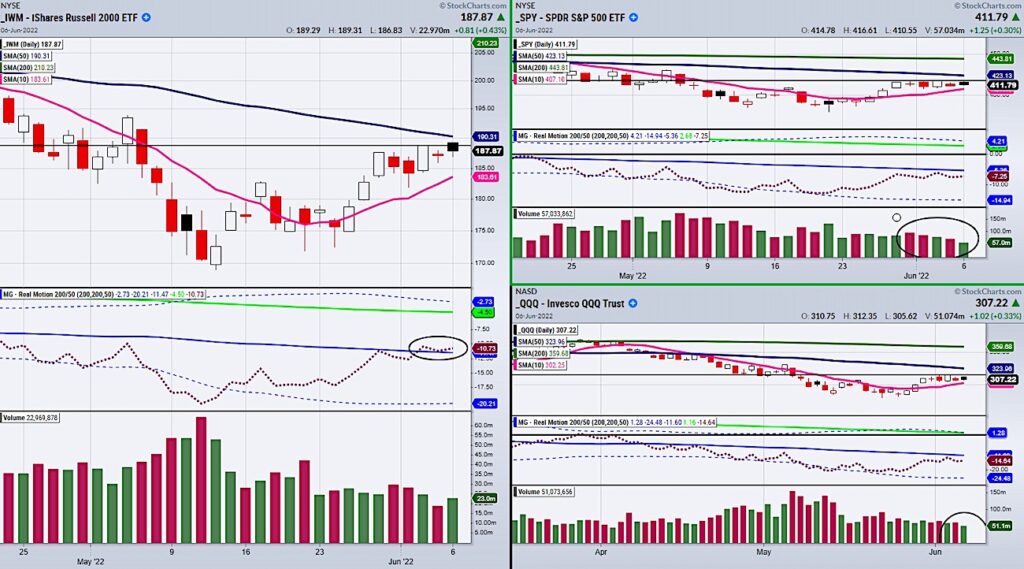
Currently, the small-cap index Russell 2000 (IWM) is leading in momentum compared to the S&P 500 (SPY) and the Nasdaq 100 (QQQ).
Looking at our Real Motion momentum (RM) indicator found in the above charts, we can see that RM is barely leading over the 50-DMA while the price is still under its 50-DMA at $190.30 in IWM.
While this is a hopeful sign, the downside is that IWM failed to hold over last Thursday’s high of $188.76.
Last Thursday is an important day for each of the indices as it represents the high of the current consolidation area.
This is a resistance level to watch for each index to clear if the market is going to take another step higher.
With that said, let’s analyze what to look for next in the SPY and QQQ along with the subtle clues volume can give when watching for the next big price move.
Looking at the SPY, if we want to clear our mini consolidation area, we will need to pass $417.44.
If this price level does clear, next we can look for momentum to follow with RM clearing over its 50-DMA.
When using RM as a trade confirmation indicator, it helps to wait for both price and RM to align, meaning that both price and RM will have to trade over its 50-DMA to show agreement.
The same goes for the tech-heavy Nasdaq 100 (QQQ) which also has RM and price underneath its 50-DMA.
With that said, let’s turn our focus on volume.
Notice that across the board volume is lower than average.
This is one reason why Monday’s attempted breakout in IWM didn’t work.
While low volume is fine for consolidation areas, when looking for meaningful breakout days, it helps if a pivotal price is cleared along with increased volume.
Price will often continue in the breakout direction if accompanied by high volume.
Therefore, we have 3 things to watch for when looking for the next major market move to the upside.
Big volume days, momentum confirmation, and for our pivotal price levels to clear and hold over Thursday’s high of last week.
Stock Market ETFs Trading Analysis:
S&P 500 (SPY) 417.44 to clear.
Russell 2000 (IWM) 188.76 to clear and hold.
Dow Jones Industrials (DIA) 334.73 the 50-DMA resistance.
Nasdaq (QQQ) 314.56 resistance.
KRE (Regional Banks) 65 resistance.
SMH (Semiconductors) 248.35 17-week exponential moving average.
IYT (Transportation) 235.70 pivotal area.
IBB (Biotechnology) 112 support area.
XRT (Retail) 68 to clear.
GLD (Gold) 171.89 pivotal.
USO (oil) inside day.
DBA (Agriculture) 22.18 the 50-DMA. 21.80 support area.
Twitter: @marketminute
The author may have a position in mentioned securities at the time of publication. Any opinions expressed herein are solely those of the author and do not represent the views or opinions of any other person or entity.


