This last week has brought a new spirit of uneasiness to the market due to unprecedented bank failures involving Silicon Valley Bank and Signature Bank.
Despite the ongoing weakness in regional banks, and the very real threat of a broader contagion for risk assets, the technology sector is holding up quite well!
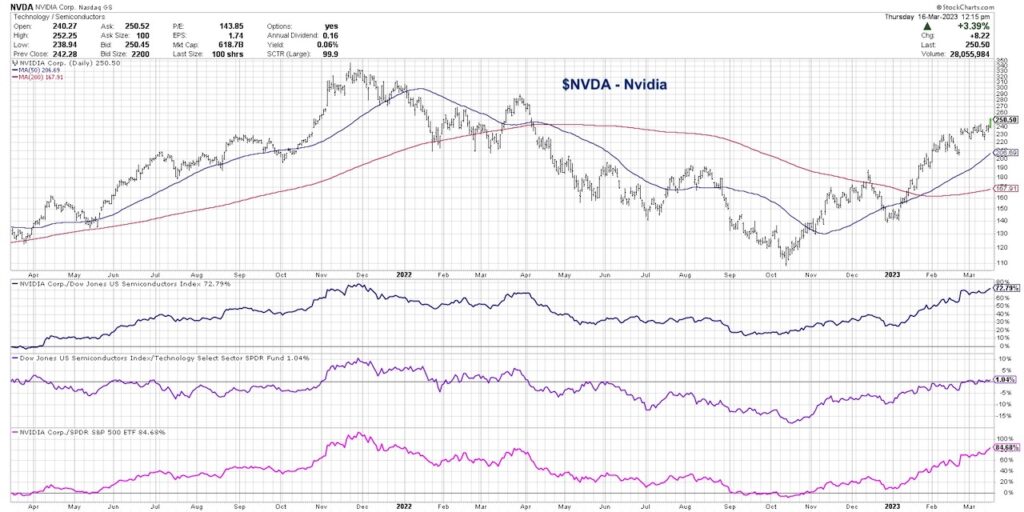
Stock charts like Nvidia (NVDA) strike me as a reminder that regardless of the overall market direction, it pays to lean into strength. Let’s review the evidence over the last six months.

We can see that price is making a clear pattern of higher highs and higher lows. Nvidia is trading above two upward-sloping moving averages, which confirms the strength of the uptrend. The three panels below the price show that 1) NVDA is outperforming other semiconductor stocks, 2) semiconductors are outperforming the technology sector, and 3) Nvidia is outperforming the broader market.
Could a chart like NVDA stall out and turn lower tomorrow, ending this incredible run of outperformance? Certaintly. But my experience tells me to that this sort of trend tends to persist until proven otherwise.
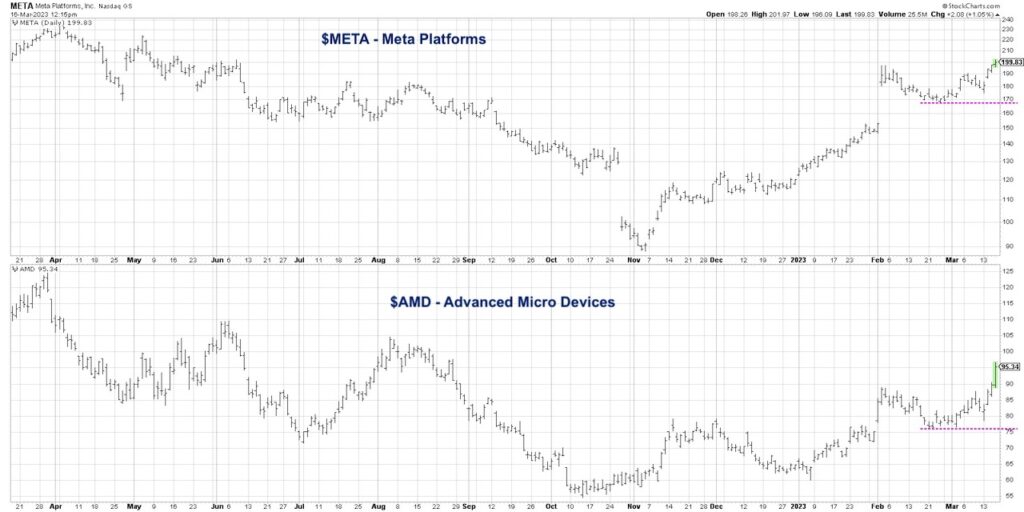
In today’s video, we’ll use technical analysis to analyze two other growth stocks thriving despite the volatility: Meta Platforms (META) and Advance Micro Devices (AMD) — see video below and charts further below.
- How can we clearly define the upside potential of these two outperforming charts?
- What tools can we use to manage risk and limit drawdowns if the charts were to reverse?
What can the strength in META and AMD tell us about broader themes of risk appetite for investors?
[Video] $META and $AMD Stocks Showing Strength
$META and $AMD Stock Charts

Twitter: @DKellerCMT
The author may have positions in mentioned securities at the time of publication. Any opinions expressed herein are solely those of the author, and do not in any way represent the views or opinions of any other person or entity.


