The worst crime that an analyst can commit is remaining bearish in the face of a rising market.
– Richard Russell
Over the last couple months, I’ve been highlighting mounting bearish evidence, including the deterioration of market breadth indicators. We even discussed four signs that would indicate an end to the bull market phase, all of which were triggered by mid-September.
One thing I’ve learned over my career is to remember the wisdom of Richard Russell, who authored the widely-followed Dow Theory Letters for over fifty years. He reminds us of the folly of remaining bearish when the market is telling you that conditions are bullish.
As another legendary technical analyst named Paul Montgomery once said, “The most bullish things the market can do is go up.”
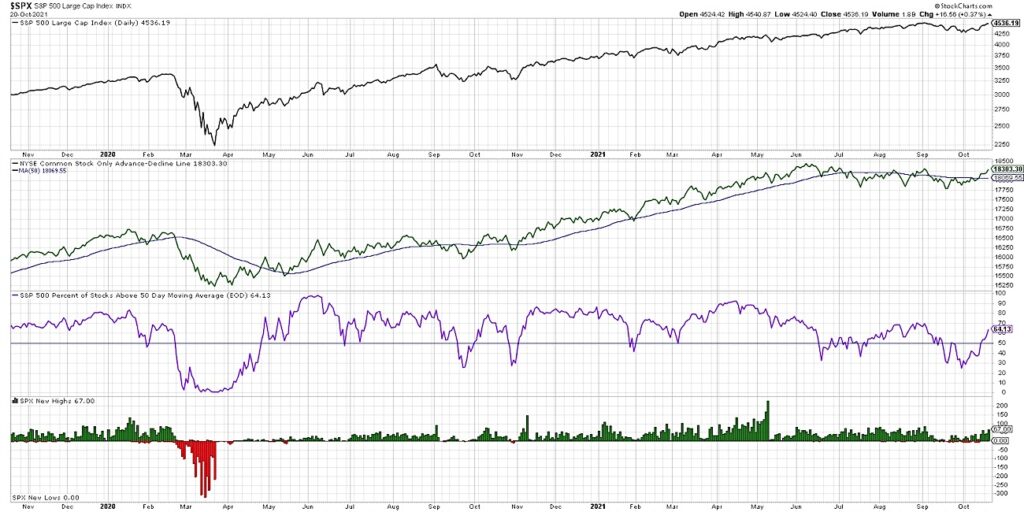
In today’s video, we’ll review the weight of the evidence using three breadth indicators: the cumulative advance-decline line, the percent of stocks above their 50-day moving average, and the new 52-week highs and lows.
We’ll break down where they’ve been, where they are now, and what they can tell us about the potential for further market upside. Here’s a few questions we try to answer:
- What does the NYSE Common Stock Only Advance-Decline indicator suggest in terms of broad market participation?
- How many S&P 500 stocks are now back above their own 50-day moving average, versus less than 30% in mid-September?
- Why is it important to track the new 52-week highs, and are they confirming this recent upswing in the S&P 500 and Nasdaq?
Ready to upgrade your investment process? Check out my free course on behavioral investing!
(VIDEO) One Chart: 3 Market Breadth Indicators To Watch
Stock Market Breadth Indicators Chart

Twitter: @DKellerCMT
The author may have positions in mentioned securities at the time of publication. Any opinions expressed herein are solely those of the author, and do not in any way represent the views or opinions of any other person or entity.


