More confident consumers spend more, and more confident CEOs are more likely to invest for the future. There is a strong relationship between CEO confidence today and real capital spending over the coming year. Meaningful tax reform and a more favorable regulatory environment could be elusive in practice, but the hope that they might be forthcoming could be enough to fuel an uptick in capital spending.
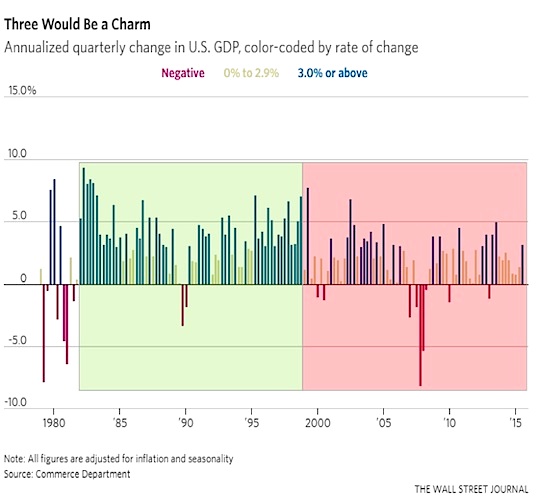
An uptick in capital spending could help fuel resurgent productivity growth. The last 15 years has been marked by a declining trend in productivity growth, not unlike what was seen in the second half of the 1960s and the 1970s. If the economy is going to emerge from the slow-growth malaise of the past 15+ years, it will likely be on the back of an upswing in productivity growth similar to what was seen in the 1980s and 1990s.
Without better productivity growth, discussions of consistent GDP growth near 3% seems far-fetched. While GDP growth of 3% has been the exception in this period of declining productivity growth, it was the rule when productivity growth was accelerating.
Another way to view these two growth regimes is relative to expectations. While forecasts were too optimistic over the past 15+ years, in the period prior to that they were consistently too pessimistic. And the surge in growth that signaled the emergence of the new regime in the early 1980s came out of nowhere. Growth surged higher as forecasts were turning lower. Similarly, the shift toward the slow-growth regime also was unexpected, with actual growth faltering at a time when forecasts were moving higher. In other words, the absence of a forecast that we may be entering a secular upswing in growth does not diminish (and could even enhance) the chances of it actually emerging.
Getting back to the evidence that is already in hand, 2016 witnessed an end of the inventory correction that was weighing on economic growth for better than a year. This provides a near-term tailwind for the economy as we move into 2017.
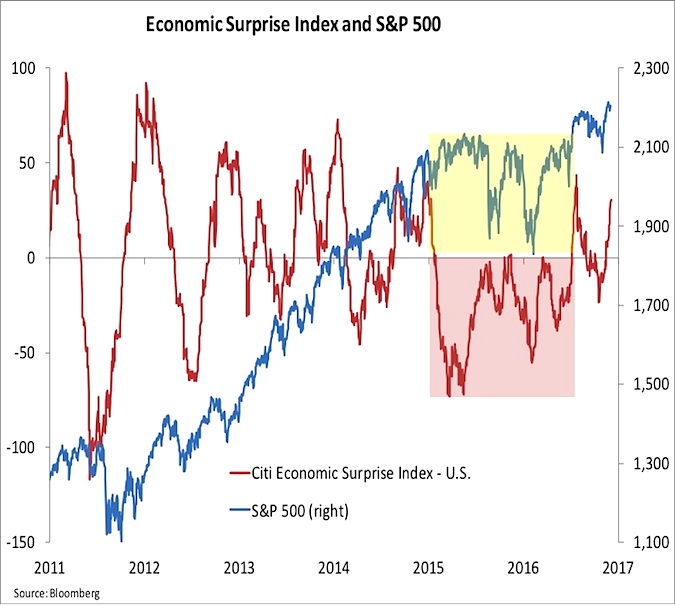
Mid-2016 also witnessed the end of a sustained period of economic data disappointments. The economic surprise index tends to swing regularly from positive to negative as forecasters overcorrect for recent misses. However, at the same time that the stock market was experiencing a cyclical bear market, the economic surprise index remained stubbornly in negative territory. While we do not expect forecasters to suddenly become more accurate, it is encouraging to see the economy being able to deliver some better-than-expected news, at least on a near-term basis.
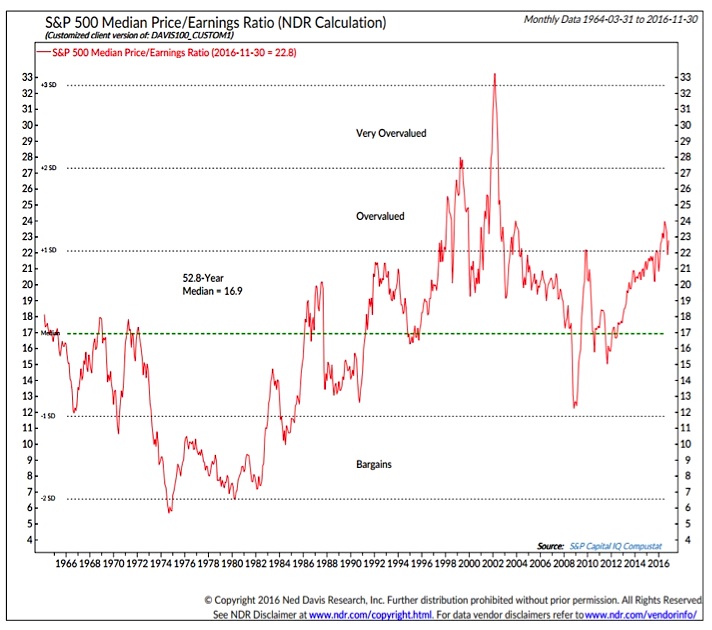
Valuations remain elevated and could be a headwind for further stock market appreciation. The median price/earnings ratio for stocks in the S&P 500 has eased slightly in recent months, but at 22.8 (as of the end of November) it is still more than one standard deviation above its long-term median below 17.
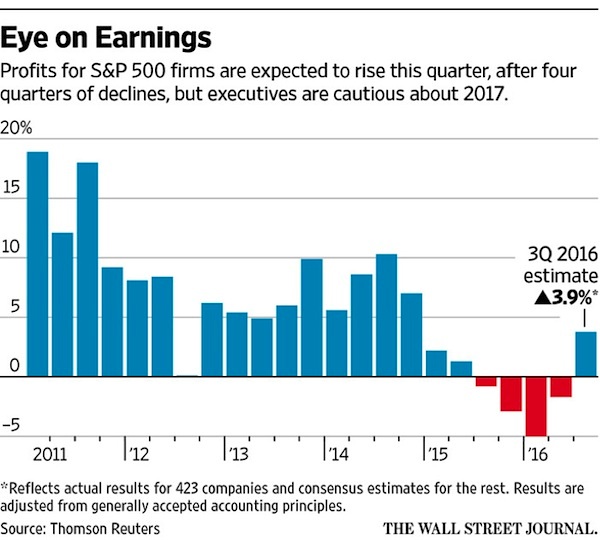
There may be good news on the horizon for valuations. Just as stocks have emerged from a cyclical bear market, and the economy has emerged from an 18-month period of persistent downside surprises, the earnings recession has also ended. Earnings grew in the third quarter at the best pace since the final quarter of 2014. This data is confirmed by the profits data in the GDP report.
Earnings forecasts have seen a pattern become well-established in recent years. Estimates for the coming year start off elevated and then work steadily lower over time. Earnings forecasts for 2017 seem to be following this pattern. If the economy is indeed entering a new period of better-than-expected growth, an early indication may be a change in this pattern and actually seeing earnings forecasts drift slightly higher. Wishful thinking perhaps, but also something we will be keeping an eye on.
Sentiment surveys will likely continue to show swings between optimism and pessimism and from a tactical perspective we will continue to try to lean away from the crowd at extremes. Heading into 2017, two longer-term indicators of sentiment are worth reviewing. From an asset allocation perspective, households have well-above average exposure to equities and well-below average exposure to cash. From this perspective, exposure to stocks looks like a crowded trade.
When looking at mutual fund and ETF flows, however, a different picture emerges. Stock funds have seen persistent outflows for over a year, while bond funds have looked like the crowded trade. Both of those trends have started to reverse as 2016 has moved to a close. Stock funds are finally attracting inflows again and bond funds have started to see outflows.
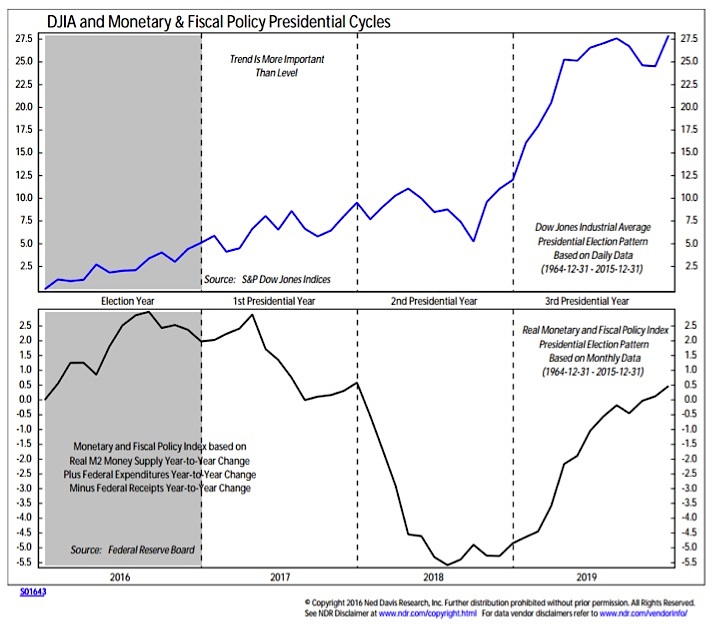
Seasonal patterns and trends offer a bullish tailwind for stocks, at least through the first half of 2017. More important in 2017 than the pattern for stock prices may be the normal pattern for stimulus. Typically, the first two years of a presidential term are marked by less stimulative policies. The incoming administration faces high expectations of a more favorable environment. Unified control of Congress and the White House seem to favor bucking the historical pattern, and if this happens, it could help keep seasonal tailwinds blowing for stocks.
continue reading on the next page…

