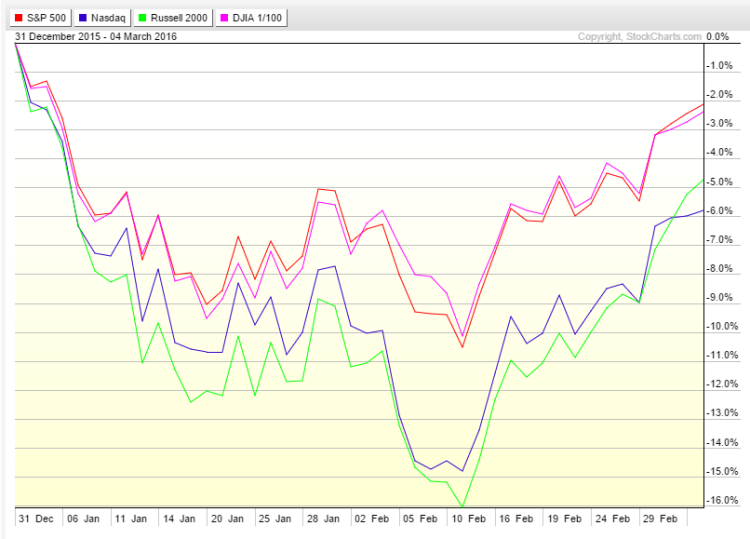
The 2016 stock market has been quite eventful, as active investors have navigated through increased gyrations and volatility. Just three weeks ago, the Nasdaq Composite and the Russell 2000 were down approximately -15% and -16%, respectively. As of Friday’s close (3/4/16), the Nasdaq Composite and the Russell 2000 are now down only -5.80% and -4.75%, respectively. The S&P 500 Index and the Dow Jones Industrials are down the least year-to-date at -2.15% and -2.40%, respectively, however, both indices had been down more than 10% last month.
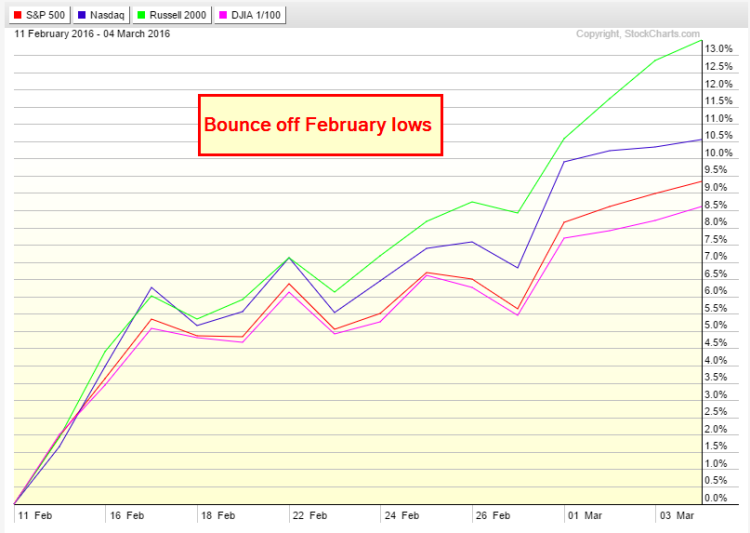
Since the S&P 500 retested the low from January back on February 11, the index has seen a powerful move higher, rising by 11% on a low-to-high basis and by 9.34% on a closing basis. The Russell 2000 has staged an even more impressive 13.44% return since the lows from February (closing basis).
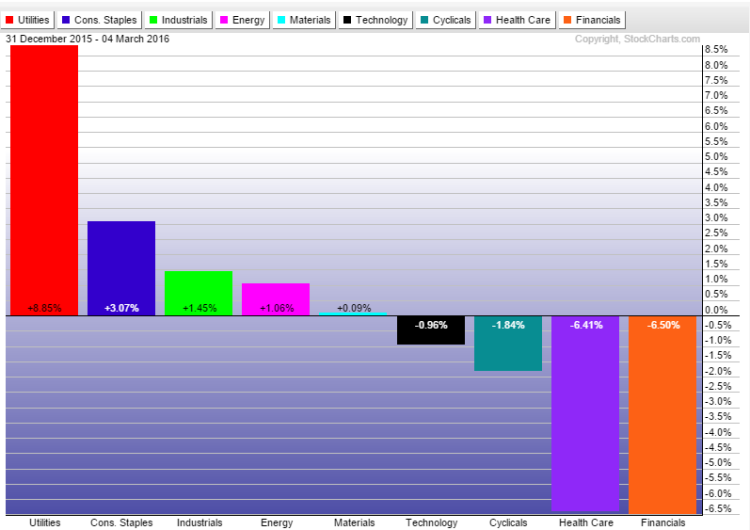
From the year-to-date sector return breakdown below, you can see that utilities and consumer staples are still the leading sectors while healthcare while financials stocks lag. This is a good glimpse of the composition of the 2016 stock market thus far.
Based on my StockTwits and Twitter stream, it seems that this recent move higher in the stock market has taken many by surprise, both in magnitude and speed. Many people, including myself, did not expect the market to bounce as far and as fast as it has, especially given the large pullback that we had seen earlier this year. Despite the S&P 500 being up nearly 10% from its February lows, there still seems to be a degree of investor pessimism, as many market participants seem skeptical of this recent move higher and doubtful of a continued move higher. This may help explain recent equity fund outflows.
What I would like to do now is offer a more detailed look at the current state of the 2016 stock market and offer some thoughts on where it may go.
As previously mentioned, the market (specifically, the major stock market indices) had a relatively severe correction earlier this year followed by a more recent rally (bounce) off lows. To illustrate the strength of this recent bounce, I would like to look at several breath indicators.
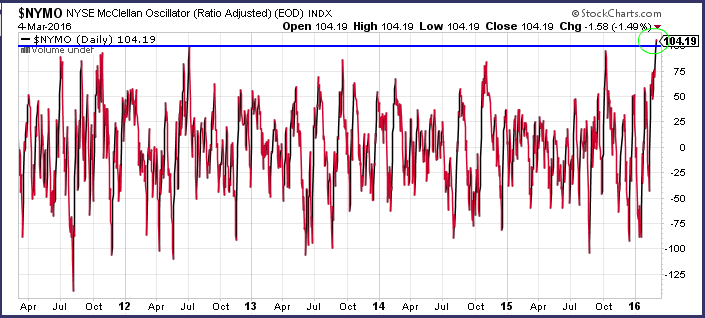
First, let’s take a look at the NYSE McClellan Oscillator making a new 5-year high.
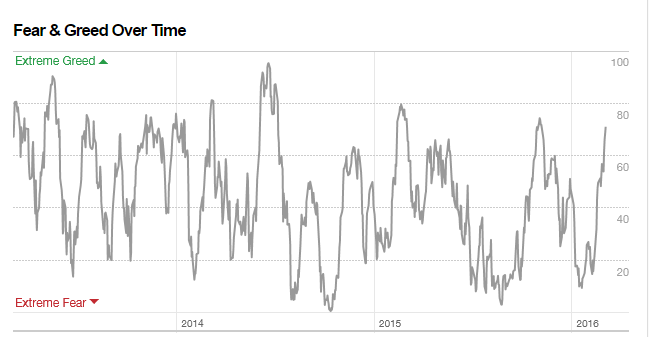
Next, the CNN Fear & Greed Index is sitting at 71, which is towards the top of the index’s range.
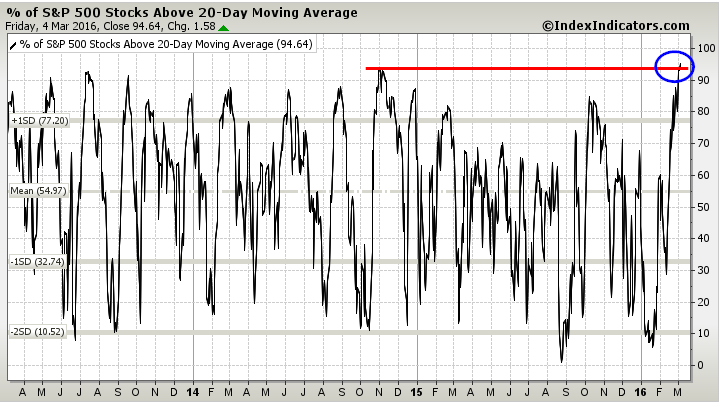
Third, the percentage of S&P 500 stocks above their 20-day moving average is currently 94.64%, which is above the high from late 2014.
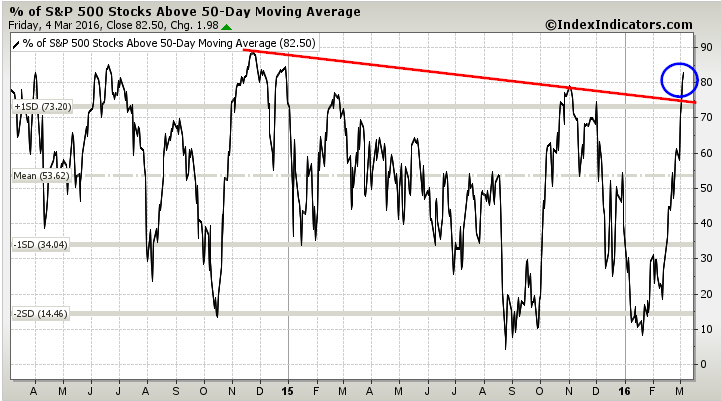
The percentage of S&P 500 stocks above their 50-day moving average is currently 82.50%. Notice in the chart below that the downtrend line from last year has now been broken.
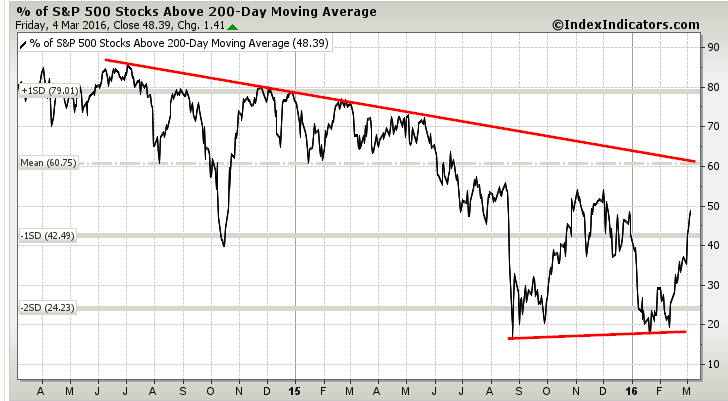
While the percentage of S&P 500 stocks above their 200-day moving average is still well below the multi-year downtrend line and currently sits at less than 50%, it’s worth noting just how quick this market breath indicator rebounded of recent lows.
continue reading on the next page…

