I’m not going to spend any time on the debt bomb fuse (see this McKinsey study) or QE or Margin Debt or any other piece of fundamental evidence. Just the charts, folks. And today we’ll focus on the 20+ Year Treasury Bond ETF (TLT).
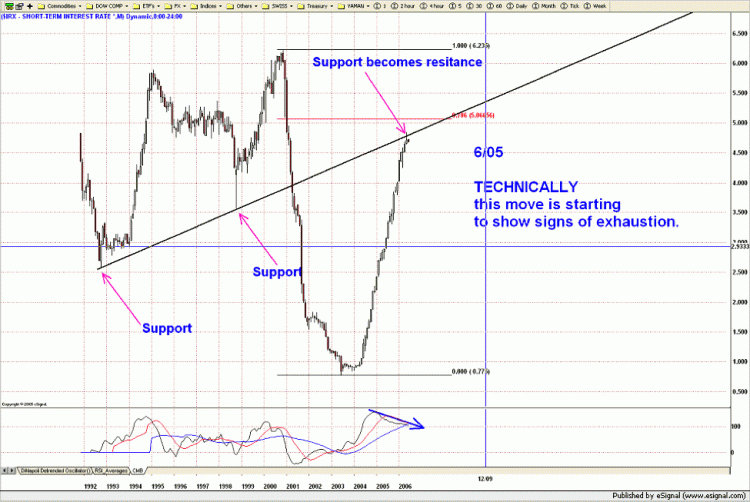
But before we get to the TLT, let’s go way back to 2007 when the FED was RAISING RATES. At that time, a hedge fund client of mine asked me what I thought would happen with the next FED Decision regarding rates. I told him the FED was running into resistance. He laughed.
Folks, if you can chart it you can find a PATTERN. Here’s the REAL TIME look at the short-term interest rates going into that FED meeting. The FED had raised rates right into the .786 retracement.
- The frequency of a string is inversely proportional to the square root of its weight (length)
- The frequency is also directly proportional to square root of it’s tension
- 1.618’s square root is 1.27 and 1/1.27 = .786
Here’s the chart:
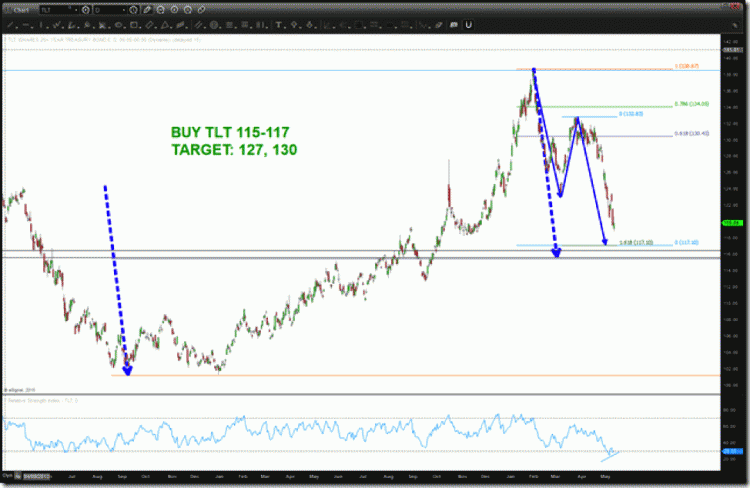
Treasury bonds have been a safe haven for the past 5 years. But this latest down turn has really spooked some investors. And for good cause. Rates appear like they are setting up for a rise. But that’s not today’s business. Right now, it looks like rates may stabilize and head back down. Again, just for now. And note that bond sentiment that is getting worse each day. This could be a tradable setup for the 20+ Year Treasury Bond ETF (TLT).
TLT Daily Chart
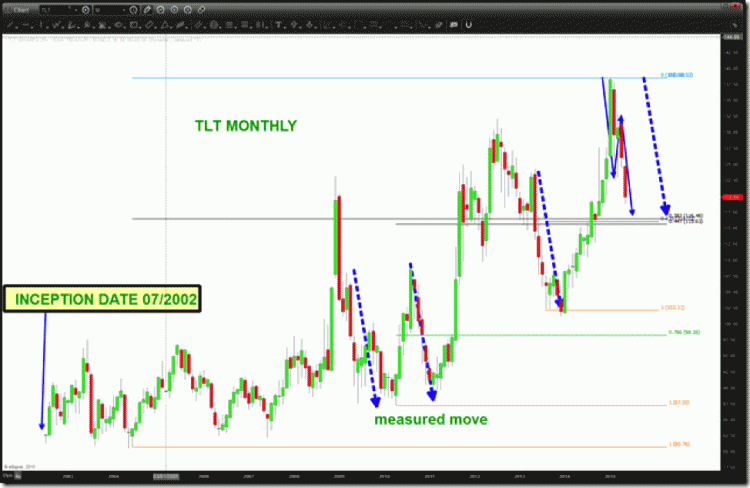
We have measured moves, retracements, projections, structure, bullish divergence (daily) so one would expect the TLT to find support in the 115-117 area.
TLT Monthly Chart
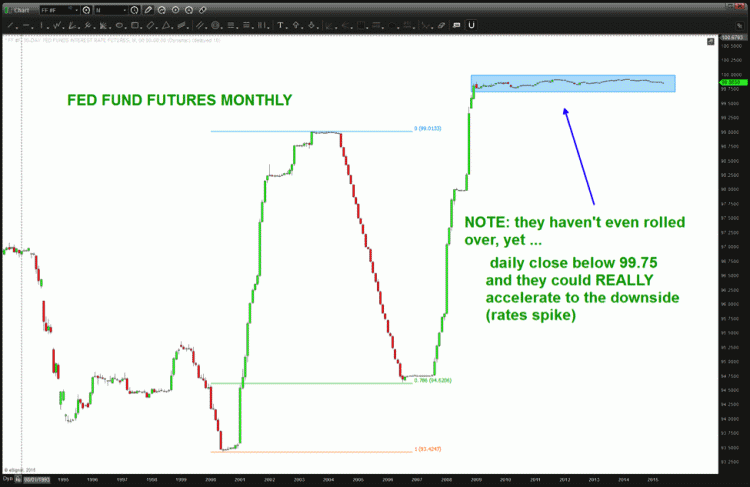
One last chart below and that is the Fed Fund Futures. What do traders think the FED is going to do? Right now? Absolutely nothing.
However, if we get a close below 99.75 and this thing could REALLY accelerate to the downside – which equates to rates spiking.
Stay tuned and thanks again for reading.
Follow Bart on Twitter: @BartsCharts
No position in any of the mentioned securities at the time of publication. Any opinions expressed herein are solely those of the author, and do not in any way represent the views or opinions of any other person or entity.


