On Monday, the Retail Sector ETF (NYSEARCA: XRT) went green.
However, as I wrote last night, we still do not know if “in the current bearish phase, we know that short covering and premature buyers cause whipsaws.”
So, I am going to make it real easy.
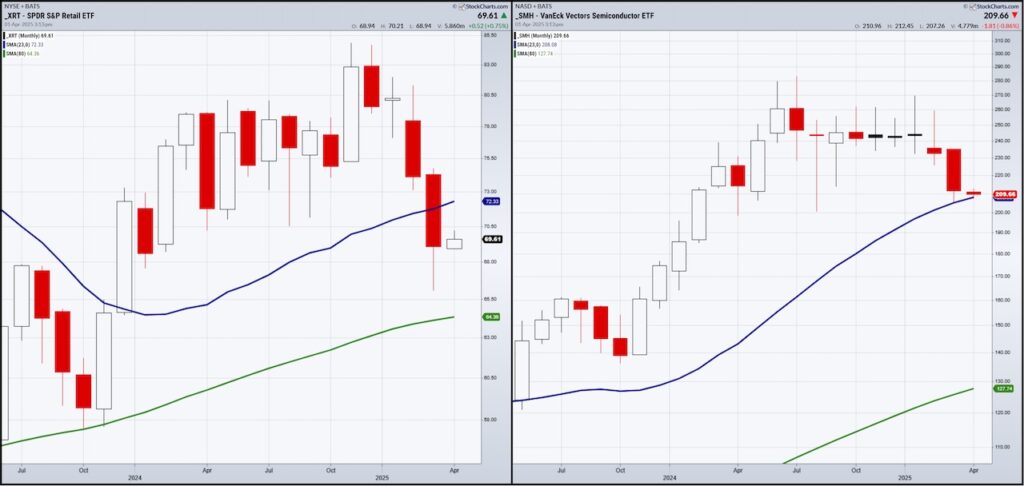
The Retail Sector (XRT), looking at the monthly chart, is under the 23-month moving average.
That tells us the consumer and spending confidence is in a 2-year business cycle contraction.
Recession, no. Stagflation, yes.
XRT must either run up and clear that moving average in April or get ready for more pain.
Even more interesting is the Semiconductors Sector ETF (NASDAQ: SMH).
In March, the Semiconductors ETF (SMH) fell to its 23-month moving average.
Here it is the first day of April, and SMH is hanging onto the blue line for dear life.
Why is this significant?
A break of the 23-month will put SMH into a contraction for the first time since 2022-2023 during the aggressive rate hike cycle.
We can draw a few conclusions if we combine these 2 important members of the Economic Modern Family.
- SMH holds or at least stays close to the 23-month and Granny XRT runs to its 23-month MA and stalls.
- SMH fails the 23-month and XRT falls further.
- SMH rallies from here (or XRT) and now we have nothing more than a correction and a tradeable low with a good solid bounce.
Twitter: @marketminute
The author may have a position in mentioned securities at the time of publication. Any opinions expressed herein are solely those of the author and do not represent the views or opinions of any other person or entity.


