The majority of commodities have been beaten down this year and railroad stocks like Union Pacific (UNP) and Canadian Pacific Railway (CP) that carry coal and oil haven’t fared much better. Year to date, U.S. railroad cumulative volume is down 4%.
But the sell off in railroad stocks may be overdone, at least in the intermediate-term, when you factor in the cheaper valuations, bullish price action, and poor overall sentiment in the sector ahead of Q3 earnings later this month.
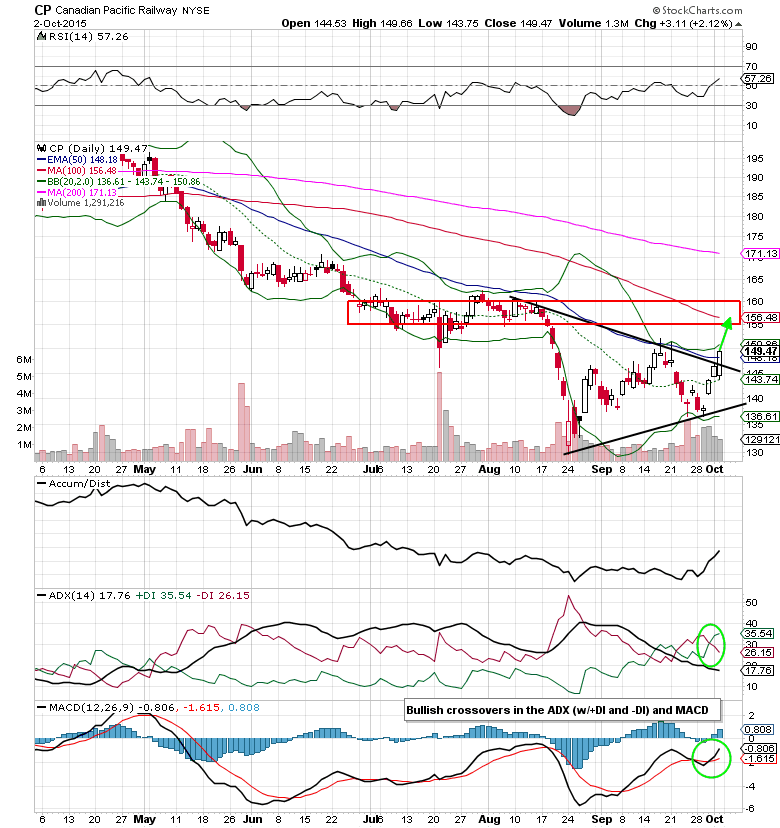
Let’s start by taking a look at Canadian Pacific Railway (CP). In the chart below, you can see that the higher low that was put in last month was a precursor to a breakout above the wedge pattern (and the 50-day exponential moving average).
With shares down 22% year to date (compared to the Dow Jones Transportation Average’s 13.9% decline), a snapback rally may be underway. One potential target could be resistance at the $155-$160 price level – where I would expect sellers step in once again.
Canadian Pacific Railway (CP) Daily Stock Chart
The fundamentals for Canadian Pacific Railway:
- CP trades at a P/E ratio of just 12.44x (2016 estimates)
- Price to sales ratio of 4.65x
- Price to book ratio of 5.99x.
- The 5-year TTM P/E ratio of 18.88x is below the historical average of 26.03x too.
- Earnings are projected to increase in the mid to high teens annually as revenue ticks up in the mid single digit range, which isn’t great, but its better than most of the competition.
CP Options Trade Idea I’m Considering
Buying the Nov 20 $150/$160 bull call spread for a $4.00 debit or better
Stop loss- $1.75
1st upside target- $7.00
2nd upside target- $9.50
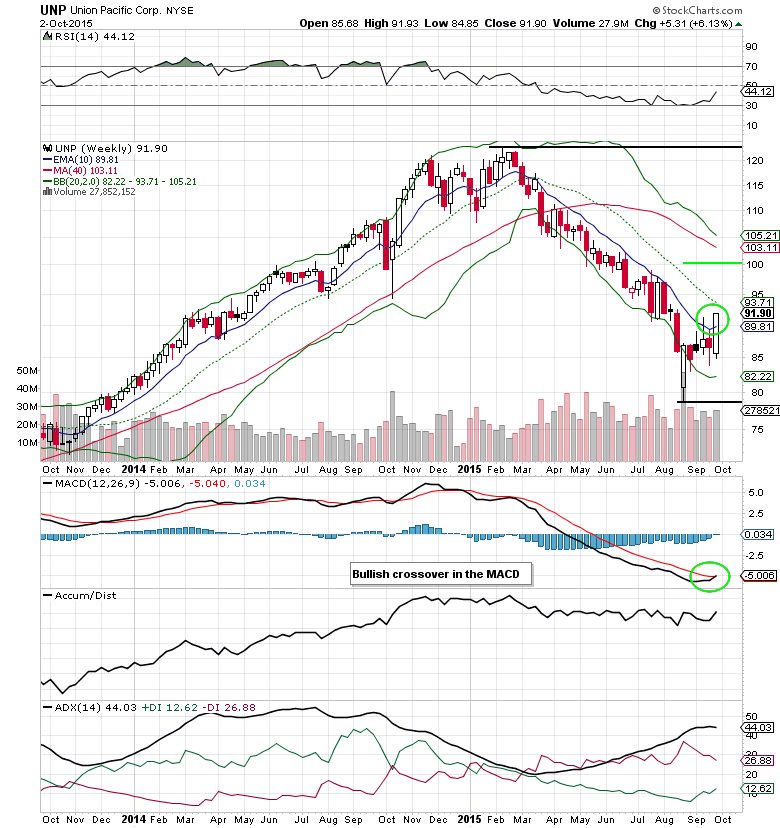
Another one of the beaten down railroad stocks is Union Pacific (UNP). Analyzing the weekly chart of UNP, the industry leader is finally taking out the 10-week EMA (50-day EMA). Last week’s 6%+ gain resulted in the first close above the key moving average in about 7 months. While there is short-term resistance at $95, a 50% retracement of 2015’s high and low could mean a bullish continuation to $100.64 later this year.
Union Pacific (UNP) Daily Stock Chart
The Fundamentals for Union Pacific:
- Similar to Canadian Pacific, UNP is trading at a discount at a (15.80x) to the 5-year historical earnings multiple of 17.48x.
- In the latest quarter they reduced operating expenses by 8.9% to $3.48B, helping the company maintain a sizable cash holding and better position them once economic trend shift in the industry’s favor.
It might be a minute data point, nevertheless total railroad traffic spiked higher by 8% in early September. On September 30th, Goldman Sachs reiterated their buy rating on the stock, confirming recent research from the likes of Bank of America and RBC Capital.
UNP Options Trade Idea I’m Considering
Buying the Nov 20 $92.50/$100 bull call spread for a $2.60 debit or better
Stop loss- None
1st upside target- $5.00
2nd upside target- $7.25
Thanks For reading and have a great week.
Twitter: @MitchellKWarren
No position in any of the securities mentioned at the time of publication. Any opinions expressed herein are solely those of the author, and do not in any way represent the views or opinions of any other person or entity.


