Happy 10-year anniversary? Or maybe not for investors…
It’s been exactly 10 years since the S&P 500 Index (INDEXSP:.INX) recorded a major stock market top.
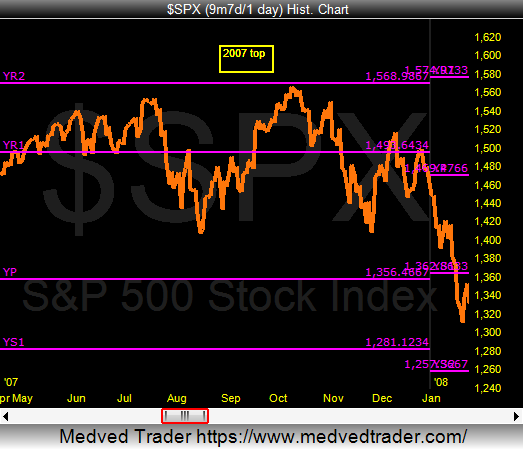
On October 11, 2007 the S&P 500 hit 1576 – the high that preceded the financial crisis. That top came at an important pivot point – the Yearly R2 price pivot. See below.
S&P 500 topping chart from 2007
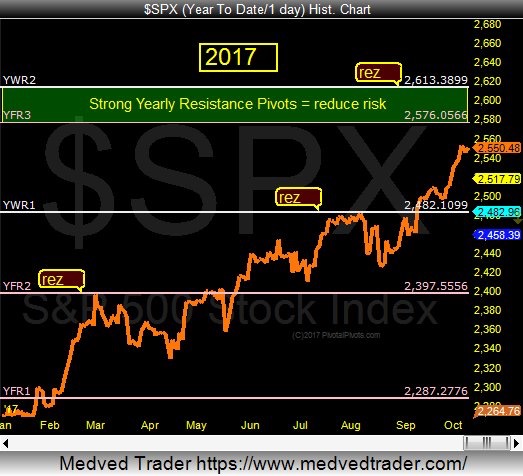
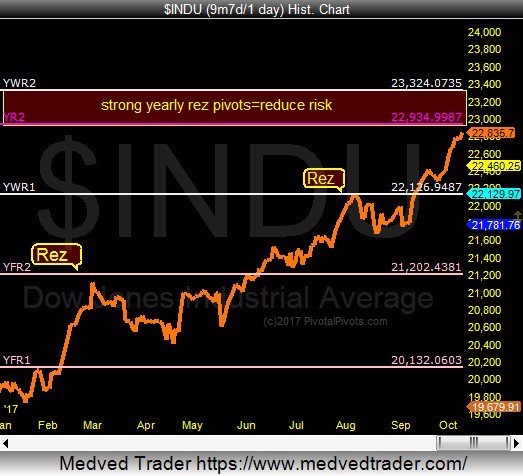
Today marks the 10-Year anniversary of that very 2007 top. And the stock market is once again at risk of correcting as it approaches the very same price pivots. Both the S&P 500 (SPX) and the Dow Jones (DJIA) are approaching their 2017 Yearly R2 Pivot Points! Deja vu?
Price fails at the Yr2 pivots 82% of the time. The average pullback is roughly 100 SPX points or 1,000 DJIA Points. See today’s charts below:
S&P 500
Dow Jones Industrials
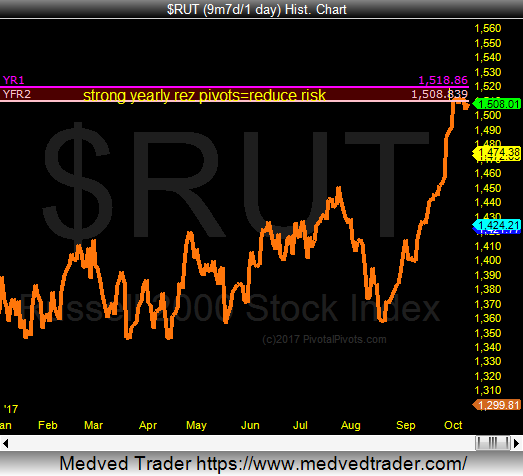
Looking at the Russell 2000 small cap index (INDEXRUSSELL:RUT) you can see that it is also testing strong resistance here at it’s Yearly R2 pivot points.
Russell 2000
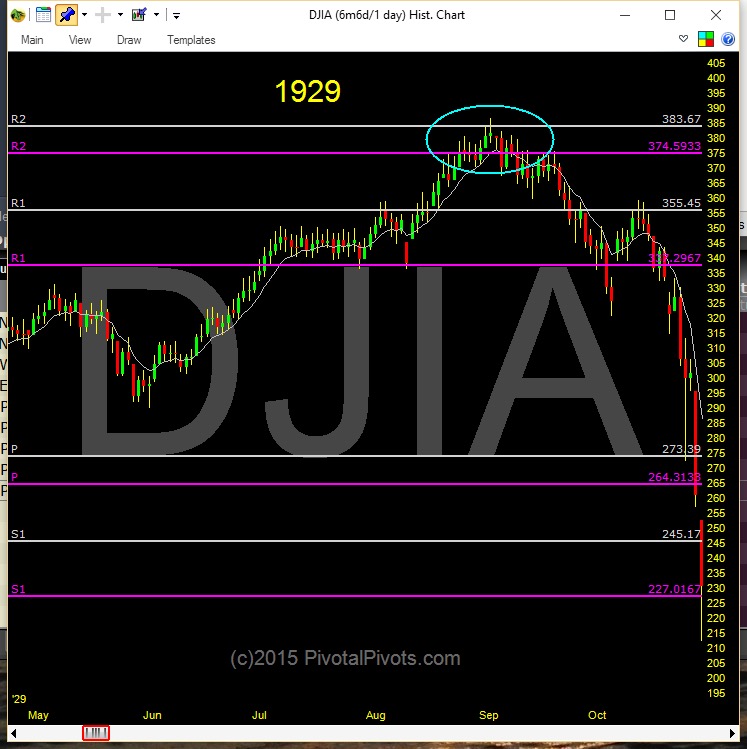
The 1929 Stock Market Crash
In 1929, the high on the Dow Jones Industrials Average (INDEXDJX:.DJI) before the big stock market crash was also at the Yearly R2 pivot points.
All of the major US stock market indexes are at or near strong yearly resistance pivots, where the odds of a big pullback are high. I would not be surprised to see 100 point pullback on the S&P 500 or 1000 point drop on the Dow Jones very soon! Keep some powder dry!
Know in advance where the “Pivots Points” are with my private service on my site PivotalPivots. Thanks for reading!
Twitter: @Pivotal_Pivots
The author may have a position in mentioned securities at the time of publication. Any opinions expressed herein are solely those of the author, and do not in any way represent the views or opinions of any other person or entity.

