10-Year Treasury Bond Yield Chart INDEXCBOE: TNX
Treasury bond yields are all over the financial news and on the minds of investors today.
With Fed Chairman Powell giving a speech at Jackson Hole today, the world will listen in to see if he gives hints on the Federal Reserve’s next interest rate move.
In today’s 2-pack, we take a closer look at treasury bonds.
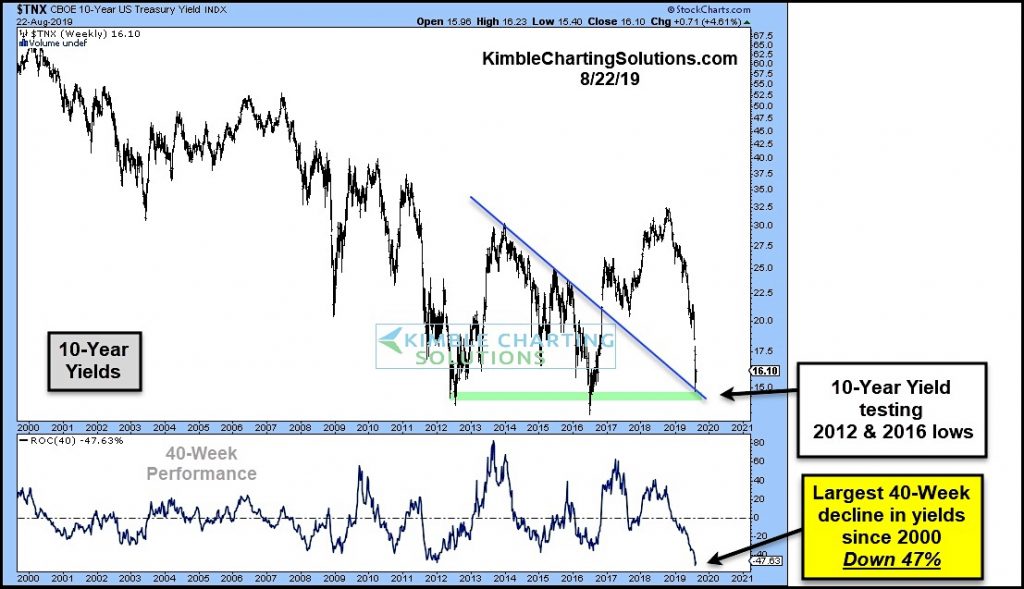
In the chart above, you can see that 10-year treasury bond yield has now declined 47% in the past 40 weeks. That’s the largest 40-week decline in 20 years!
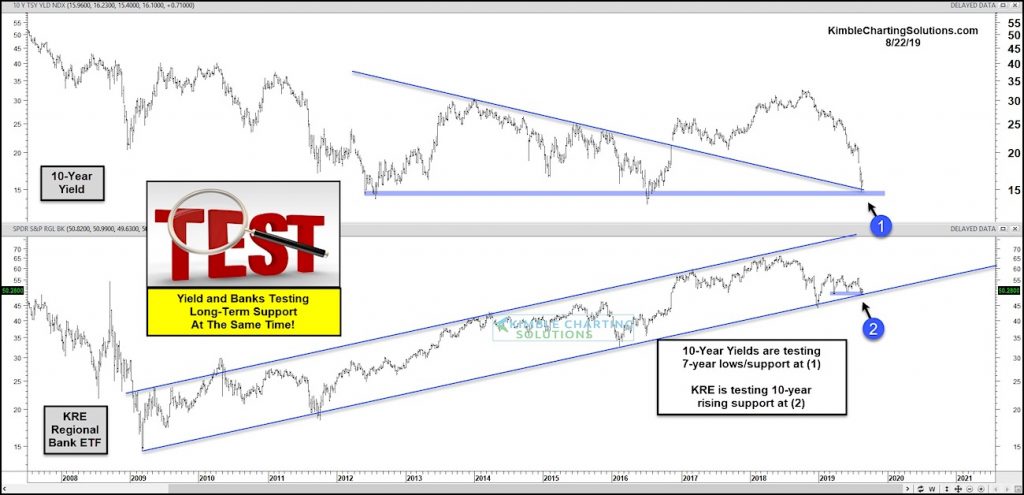
The decline in yields now have the 10-year yields testing critical support. This also comes at the same time that the Regional Banks NYSEARCA: KRE are testing 10-year support as well – see chart below.

Note that KimbleCharting is offering a 2 week Free trial to See It Market readers. Just send me an email to services@kimblechartingsolutions.com for details to get set up.
Twitter: @KimbleCharting
Any opinions expressed herein are solely those of the author, and do not in any way represent the views or opinions of any other person or entity.


