Rising interest rates have been the talk of Wall Street and Main Street for the past 2 years.
And just as many thought interest rates were peaking/plateauing, well, they seem to be breaking out again. Yikes!
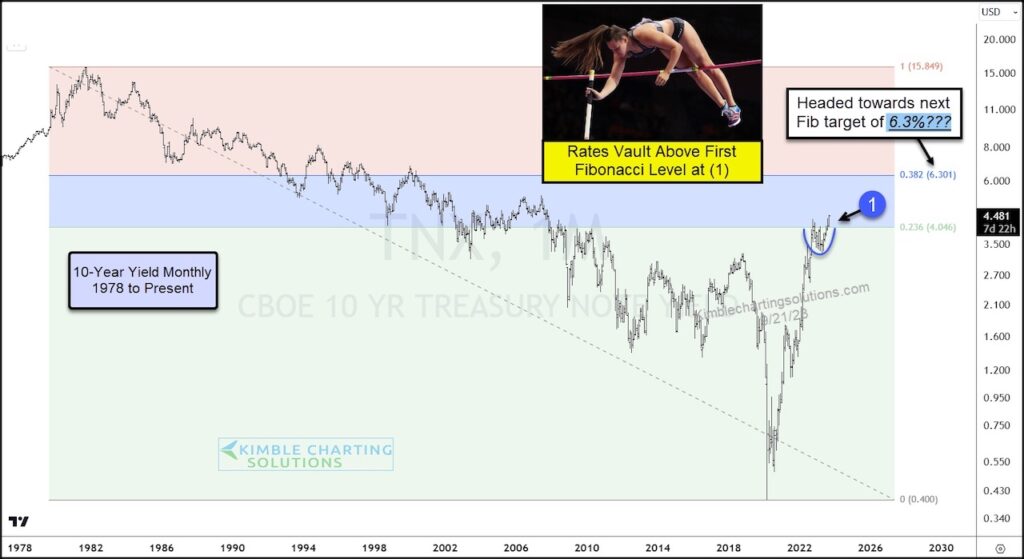
Today’s chart looks at a long-term “monthly” view of the 10-Year Treasury Bond Yield.
And as you can see, it is looking more and more every day that yields have cleared the first fibonacci level at (1), based upon all-time highs and lows in yields.
This breakout means that the next Fibonacci retracement comes into play at 6.3% – the 38.2 Fibonacci level.
That would be a 50% increase in interest rates above current levels….CRAZY! Stay tuned!
10-Year Treasury Bond Yield “monthly” Chart
Note that KimbleCharting is offering a 2 week Free trial to See It Market readers. Just send me an email to services@kimblechartingsolutions.com for details to get set up.
Twitter: @KimbleCharting
Any opinions expressed herein are solely those of the author, and do not in any way represent the views or opinions of any other person or entity.


 Trying to Bottom?")


