Bank Stocks: Another Quarter of Double-Digit S&P 500 Earnings Growth?
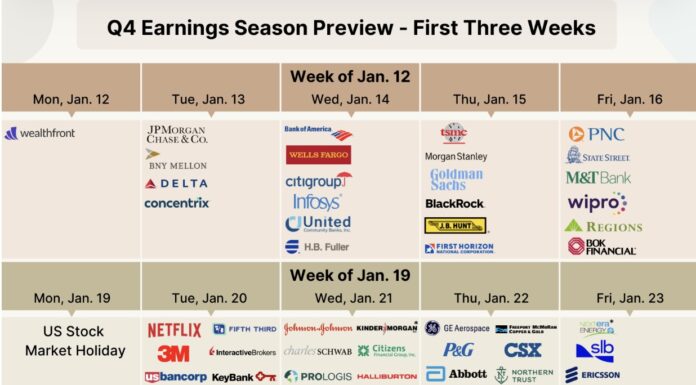
Q4 earnings for big banks were marked by robust bottom-line performance despite some top-line misses
CEOs appear confident as the earnings season kicks off according...
2026 Macro Economic Data Quiet, But Storylines Add Intrigue
Political noise, earnings momentum, and fresh economic data collide as markets recalibrate 2026 expectations
Conference commentary and bank earnings offer some clarity amid policy drama...
Will Crude Oil Supply Keep Price In Check?
The price of oil is pretty much near a five-year low, in a world where everything costs much more than it used to.
Thankfully, our cars...
How To Combat Inflation In 2026?
Prices are still pretty high, but inflation appears to have continued to cool or decelerate in 2025. Will this trend continue in 2026, or...
Q1 Investor Conference Calendar: What Matters and Why
We’re hitting the ground running in 2026. The first weekend of the new year was chock-full of geopolitical intrigue, which has (so far) been...
Aerospace & Defense Sector (XAR) Bullish Breakout Kicks Off 2026
The geopolitical storm clouds have been stubborn and just don't seem to be going away any time soon. And this could continue to boost...
Micron Stock (MU) Breakout Leading Semiconductors Higher
The "Santa" rally hasn't materialized the way that bulls would have liked it to have.
Instead of a broad-based stair step climb higher into early...
Mish’s Stock Market Outlook for 2026
I hope you all had a wonderful holiday!
I have been busy finishing my Outlook for 2026.
But before you dive in, allow me to turn your...
Investment Themes for 2026 with a Coiled Spring Stock Market
Let’s start this Daily with some crowing. But in a good way.
In December 2024, I gave the Money Show 2 picks for 2025.
Here is...


