The Grains sector was hit hard by a stronger US Dollar and oversupply concerns last year, but reversed higher late in the year. This raised hopes for a major bottom… but that typically isn’t an easy process to navigate (or predict). As I mentioned in my last update on the Grain Sector, Corn appears to have the strongest setup. BUT this all may be put in question if Wheat doesn’t hold up its end of the bargain.
Farmers, investors, and traders with a long-side bias on Ag/Grains would certainly like to see Wheat confirm a price bottom soon. Why? Because it’s never a positive to see one of the major commodities in a given sector technically break down.
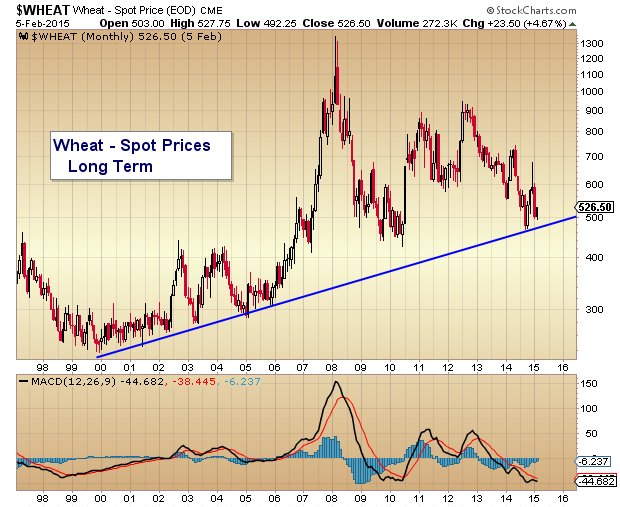
Note that in September of 2014, Wheat prices touched their 15 year trend line.
Wheat Spot Prices – Monthly Long-Term Chart
The takeaway: If Wheat can hold above this level, it would bode well for the recovery in general. That said, Wheat needs to hold this line in the sand. If it breaks lower, it would likely sting the sector… and take Soybean and Corn prices lower as well.
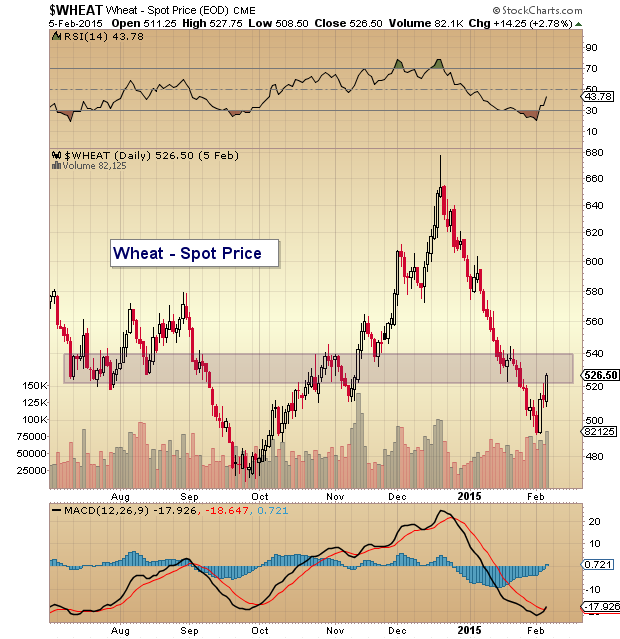
Now let’s drill down to take a look at a near-term price chart for Wheat (see below). As you can see, Wheat endured another steep decline into January, but has rallied of late. It’s MACD looks to be crossing to the upside which could be near-term price supportive. But at the same time, it is nearing a price resistance zone that should test the real strength behind Wheat’s rally.
And, lastly, when considering the importance of last year’s lows, it’s probably fair to say that this years lows ($4.92) bear technical importance as well. A break below the recent lows would likely setup an all important showdown with Septembers lows.
Wheat Spot Prices – Daily Chart
Thanks for reading.
Follow Andy on Twitter: @andrewnyquist
No position in any of the mentioned securities at the time of publication. Any opinions expressed herein are solely those of the author, and do not in any way represent the views or opinions of any other person or entity.


