Weekly Investing Outlook – Key Takeaways:
Deteriorating broad market trends suggest downside risks for the S&P 500 are growing more acute. The percentage of stocks and industry groups in uptrends is contracting and the new low list is expanding. Increased volatility has reduced investor optimism, but evidence of a marked increase in pessimism is lacking.
Two weeks ago in the space, we raised the question of whether the pullback in the wake of the late-April high on the S&P 500 would be a pause that refreshes or if it was the beginning of a more meaningful turn lower (Consolidation vs. Correction).
Developments over the past two weeks suggest the odds are tilting away from the former (consolidation) and toward the latter (correction).
While the S&P 500 remains within 5% of its all-time high, market trends beneath the surface have seen more substantial deterioration and a hoped-for surge in investor pessimism has not materialized. A break by the S&P 500 of the 2775-2800 range could set up a test of the 2600-2650 range.
While breadth indicators echoed the strength in the S&P 500 in the initial move off of the December lows, divergences have emerged over the past several months.
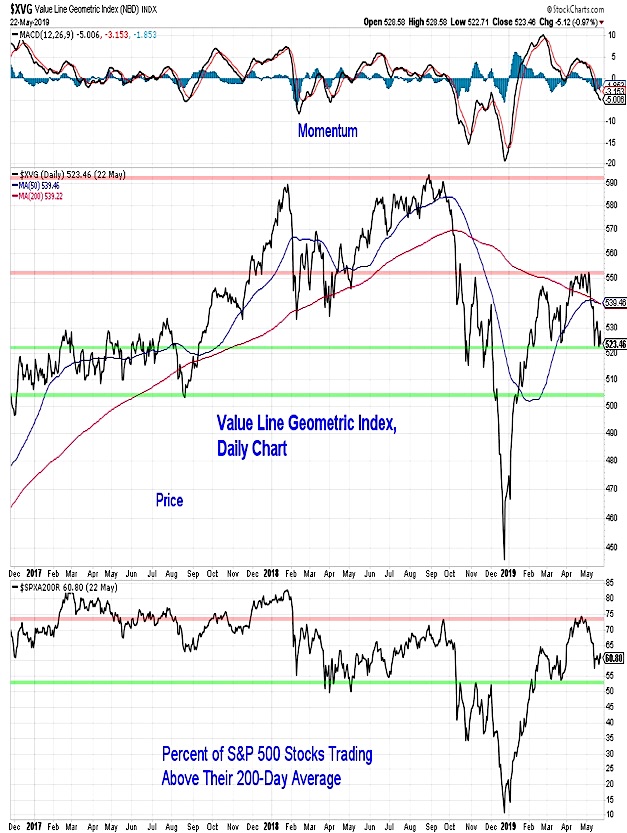
The rally in the Value Line Geometric Index (which captures the performance in the median company in the 1700-stock Value Line universe) faltered in March and has not come close to regaining its 2018 peak. With this week’s move to levels not seen since January, it appears that the multi-month consolidation in this index is resolving to the downside. Similarly the percentage of S&P 500 stocks trading above their 200-day averages is below where it was in mid-February. A break below 55% would help confirm the breakdown in the Value Line index.
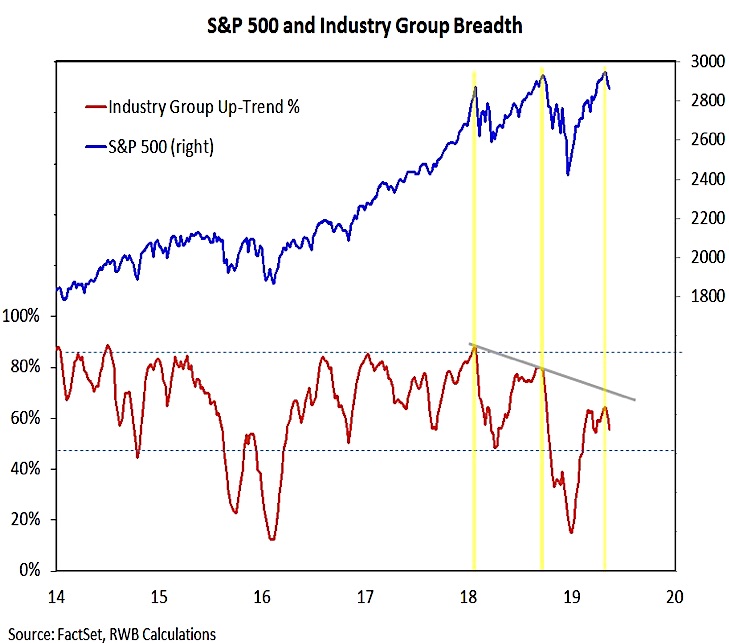
The S&P 500 has made a series of higher highs since January 2018. Each of these peaks, however, was accompanied by fewer industry groups in up-trends. After the initial move higher off of the late-2018 lows some consolidation in our industry group trend indicator would not be surprising or even unwelcome. In some ways this echoes the move by the Value Index mentioned above.
Consolidation can help relieve optimism and provide a launching pad for the next move higher. The case for consolidation is weakened when indexes and indicators make lower lows. Barring a late-week reversal higher, our industry group breadth indicator will break below its March low this week, confirming other indications of broad market deterioration.
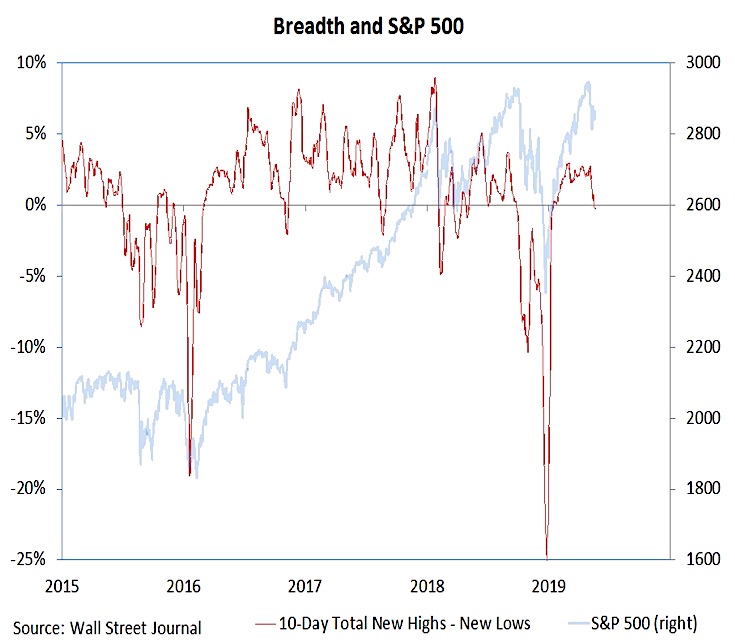
One reason that we expressed skepticism as the S&P 500 was moving to a new high in April was the lack of individual stocks making new highs. In a similar way, we have been watching the new low list, as an expansion there would suggest near-term downside risks in the S&P 500 are on the rise.
The new low lists for both the NYSE and NASDAQ are expanding, moving to their highest levels of 2019 this week. The 10-day total of new highs less new lows moving back into negative territory, especially after the relatively muted rise seen earlier this year, is evidence of deterioration at the individual stock level. A protracted stay in negative territory would be consistent with a cyclical bear market.
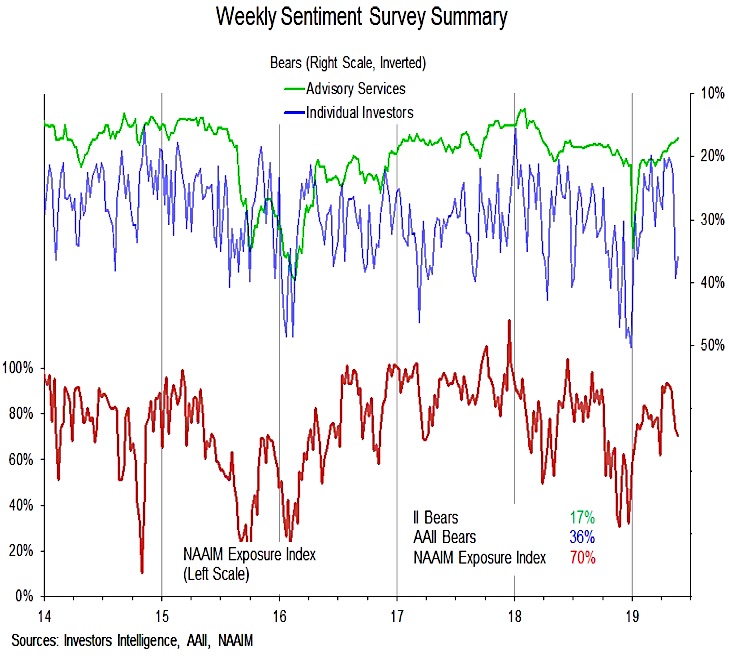
Also impacting the consolidation versus correction question is investor sentiment. Optimism rose in the early part of 2019 as prices moved higher, though bullish sentiment in various surveys remained generally shy of the 2018 peaks. With the return of some stock market volatility and the associated rise in overall uncertainty (we discussed this in last week’s Investment Strategy Outlook), we have been watching to see if optimism is replaced with pessimism. So far that has not been the case.
While bullishness in the investor surveys has waned, bearishness has been slow to emerge. Bears in the AAII survey of individual investors surged last week, before reversing course this week. Bears among the advisory services have continued to wane. A continued lack of pessimism among investors could weigh on stocks going forward.
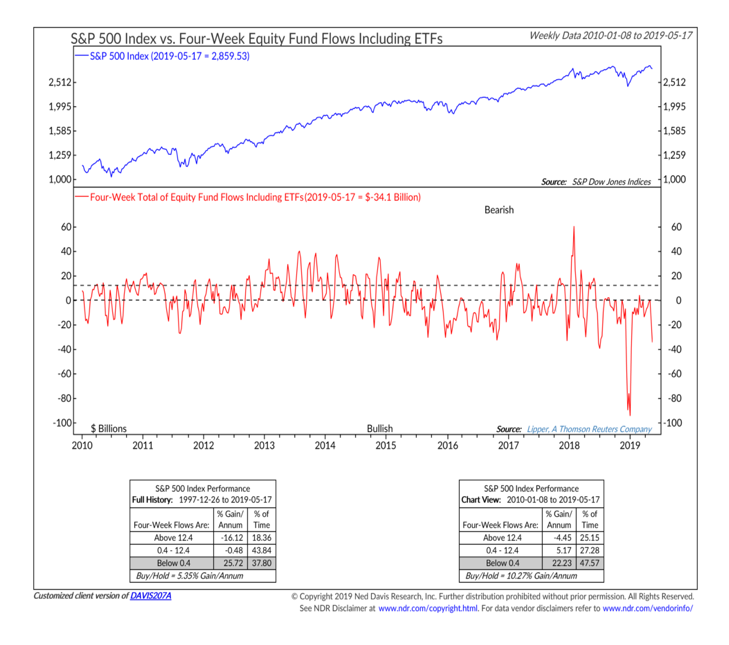
Equity fund flows have historically been good real-time indicators of investor sentiment. Stocks have tended to do well in the wake of equity fund outflows (which indicate excessive pessimism) and have struggled in the wake of surging inflows (which indicate extreme optimism). Over the past year stocks have seen elevated volatility even in the face of consistent outflows, suggesting this historical relationship may be breaking down (given the secular outflow from equity mutual funds). On a shorter-term basis, while the $100 billion of outflows in December was seen as evidence of some capitulation, that number could be eclipsed during the next downturn given the speed with which outflows have reemerged in May.
Twitter: @WillieDelwiche
Any opinions expressed herein are solely those of the author, and do not in any way represent the views or opinions of any other person or entity.

 Rolling Over At Key Fibonacci Level?")


 Rolling Over At Key Fibonacci Level?")

