A stronger US Dollar finally caused some disturbance with US corporations, especially multinationals. While reporting March-quarter earnings, one after another singled out the dollar for causing top-line shortfall.
From trough to peak between last May and March this year, the U.S. Dollar Index rallied 26 percent (see PowerShares US Dollar Bullish ETF – UUP for tradable comparison). Since that peak, intra-day it has given back six-plus percent.
One primary reason for the 10-month surge was a market expectation that short rates would begin to rise in the U.S. and that the resulting interest-rate differential would benefit the currency. As well, the Fed was expected to tighten in the middle of this year. But the economy failed to cooperate.
Real GDP barely grew in the first quarter. Non-defense capital goods ex-aircraft (proxy for business capital expenditures) has been down every month since last August. After 12 consecutive months of 200,000-plus non-farm payroll jobs, March was a dud – up only 126,000. The ISM manufacturing index remained stuck at 51.5 in both March and April.
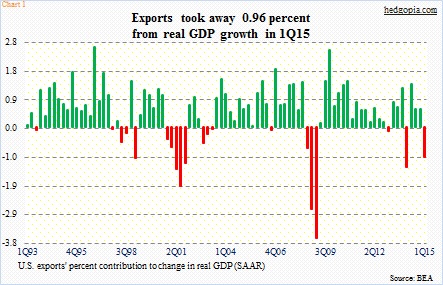
U.S. exports were not a driver in GDP growth in the March quarter. In fact, they took away 0.96 percent from growth (see the chart below). Real GDP grew only 0.2 percent in the quarter.
The sluggish growth in output has been blamed on factors ranging from harsh winter weather to the West Coast port strike.
June hike was once thought as a slam dunk. No longer. Now the general consensus is that the Fed will make a move later this year. This has impacted dollar sentiment, which explains the pullback.
The question is, is this the beginning of a trend change or just a pause before the prior trend resumes? The dollar index has indeed made lower highs since the mid-March peak and subsequently lost 96-97 support as well as its 50-day moving average.
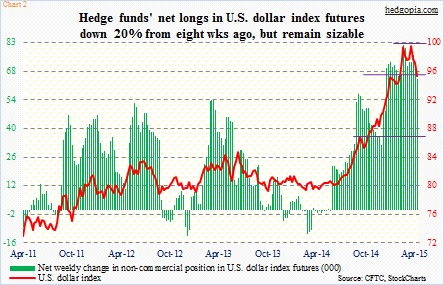
In this context, a serious correction will probably only materialize when large speculators begin to unwind their excessively high net longs in U.S. dollar index futures. These holdings are worth a watch. Eight weeks ago, they held as many as 81k contracts, which have now dropped to 65k (Chart 2). But they remain a sizable position. They started going net long just when the dollar was firming up last year and added along the way, until eight weeks ago.
If U.S. macro data do not begin to improve soon, the odds of the Fed staying pat this year will have risen significantly, and that possibility is yet to be priced in, at least going by non-commercials’ net longs.
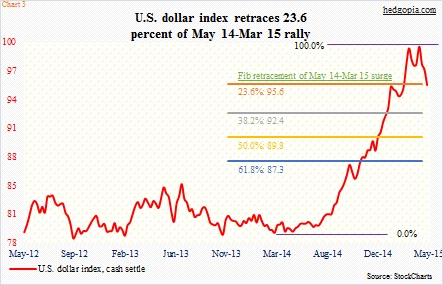
So far, the Us Dollar Index has gone through a normal, plain-vanilla pullback. Using Fibonacci retracements, the index has so far retraced .236 of the May 2014-March 2015 rally. The Chart above shows the weekly close. On a daily basis, it dropped to 94.47 last week before recovering. This area is also where its 100-day moving average lies. Daily conditions are grossly oversold.
A bounce here is possible, but it likely is a low-conviction trade. Conviction will be high if the index drops to the 92 area. In an uptrend, it is normal to correct between .382 and .618 of the prior move. At 92.40, it will have retraced 38.2 percent, which is three-plus percent away. A corresponding drop on the US Dollar ETF (UUP) will put it at 24.25 (25.03 as of Friday close). Trying to lock in that price by selling put options on the ETF does not get us anywhere, even going out a month. June 5th 24.50 puts are currently selling for $0.10. Should the US Dollar Index come under pressure this week, premiums will rise, and maybe worth a look, preferably weeklies or going out a couple of weeks.
The idea is just to generate income. Intermediate-term, the dollar decline is probably not over. Weekly momentum indicators are weakening, and have turned lower. Thanks for reading.
Follow Paban on Twitter: @hedgopia
No position in any of the mentioned securities at the time of publication. Any opinions expressed herein are solely those of the author, and do not in any way represent the views or opinions of any other person or entity.


