Key Stock Market Takeaways:
Investor sentiment surveys show widespread optimism and complacency with the S&P 500 Index trading over 3300.
With momentum tailwind, elevated optimism can persist.
Equity fund flows will signal that near-term sentiment has reached an extreme.
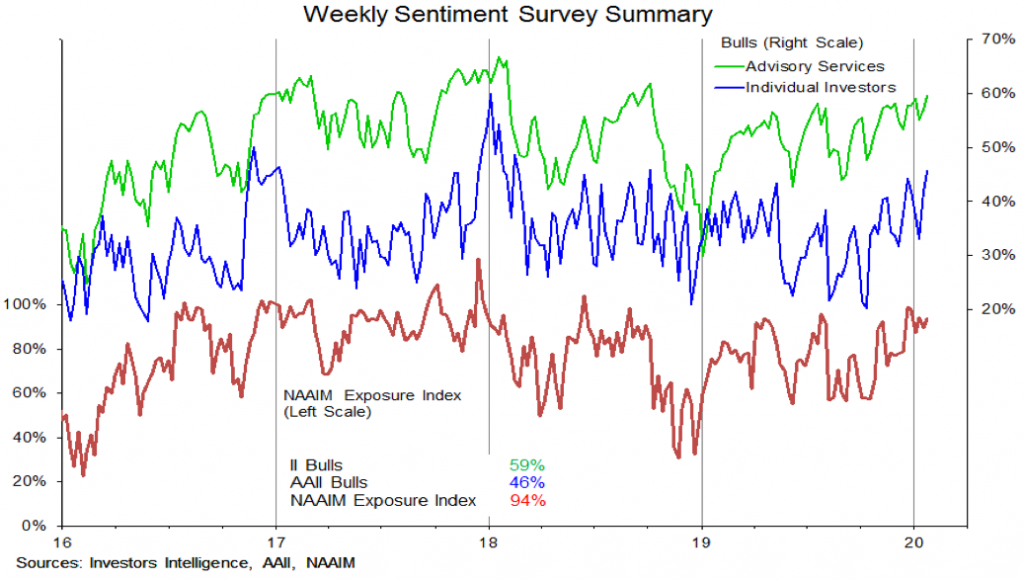
Weekly sentiment surveys shows investors have taken an increasingly bullish view on the stock market. Bulls on the AAII survey (individual investors) approached 46% this week and bulls on the Investors Intelligence survey (advisory services) are at 59% this week.
They are at their highest levels since October 2018 but remain shy of the peaks seen in January 2018.
Then, AAII bulls topped 59% and II bulls reached 66%. The NAAIM exposure index, which measures equity exposure among active investment managers, remains elevated and the details reveal a broad consensus of expectations (the deviation of responses this week was the second lowest in the 14 year history of the survey).
Despite evidence of optimism, we have kept sentiment at neutral in our latest weight of the evidence update. We have discussed the lack of a reliable signals being generated by some short-term sentiment indicators recently (Market Commentary, Jan 9).
Additionally, optimism has not been extreme enough to overwhelm the strong underlying momentum that is support stocks. We will continue to monitor the sentiment indicators (especially fund flow data) for evidence that this may be changing.
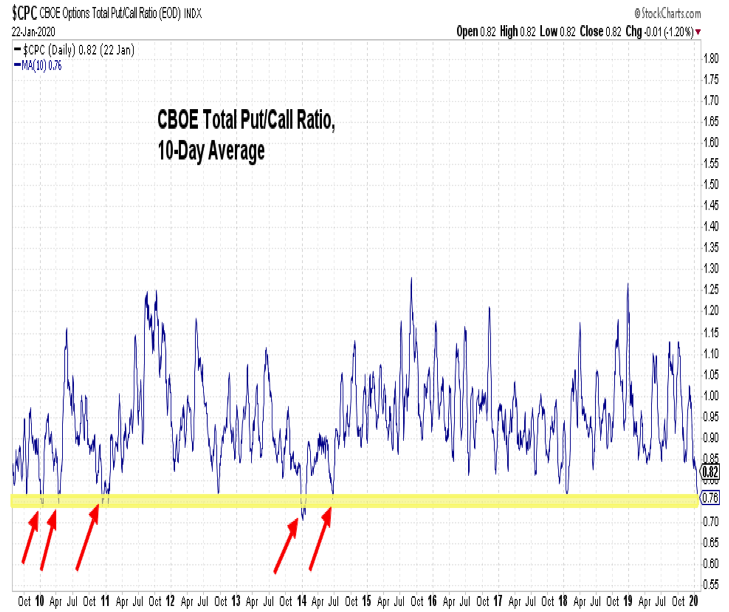
While the sentiment surveys shown on the first page show optimism at its most extreme since October 2018, options-based indicators reflect even more extreme complacency. The 10-day CBOE put/call ratio is at its lowest level since 2014 and has been at lower levels only a handful of times over the past decade. Equity-only put/call ratios have shown similar levels of complacency. As a reminder, we provided update values for these sentiment indicators every week in our Market Notes report.
The argument here is not that sentiment is not showing signs of excessive optimism. History does suggest that all else being equal, current levels of investor optimism are not generally consistent with a low-risk environment.
The point rather is that risks associated with excessive optimism tend not to become manifest until after sentiment begins to retreat (sentiment leads price) and that in periods with strong underlying momentum, optimism can persist at elevated levels for longer than otherwise expected. A recent case of this was the fourth quarter of 2017. Optimism became excessive (based on the NDR crowd sentiment poll) in September 2017 but did not peak until January 2018 (during which time the S&P 500 rallied by 13+%.
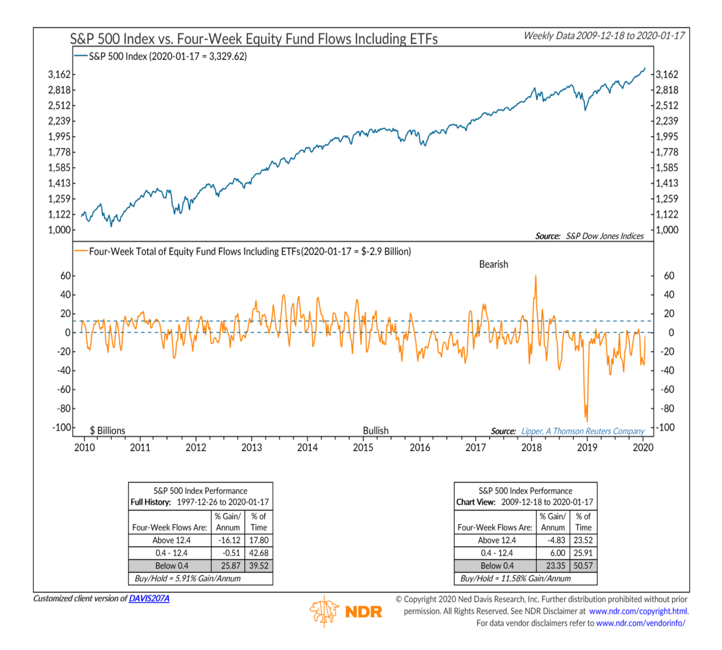
While some sentiment indicators have lost their contrarian efficacy recently, equity fund flows data has been more resilient in providing useful information. While optimism was elevated in Q4 2017, equity funds did not see a surge in inflows until January 2018 (and what a surge it was). More recently, equity funds have seen consistent and persistent outflows. While there may be demographic or other narrative explanations for this, it is the case that stocks have rallied when equity funds have seen outflows and have struggled when inflows surged. A surge in inflows now could overwhelm the momentum in stocks and signal an exhaustive point in the current rally.
It is important to note that despite the persistent outflows from equities, household exposure to equities remains historically high and exposure to cash remains historically low. Fund flows have not resulted in a significant pile of cash on the sidelines waiting to be deployed. In part, investors have moved from equities to bonds (bond fund inflows have set records of late), but more significantly the weekly flow data (in billions) is pennies on the dollar of the overall asset levels (in trillions).
A final parting caution that moves beyond the weekly ins and outs of investor sentiment data: from a longer-term perspective, elevated household exposure to equities has been inversely correlated with forward stock market returns.
Twitter: @WillieDelwiche
Any opinions expressed herein are solely those of the author, and do not in any way represent the views or opinions of any other person or entity.


