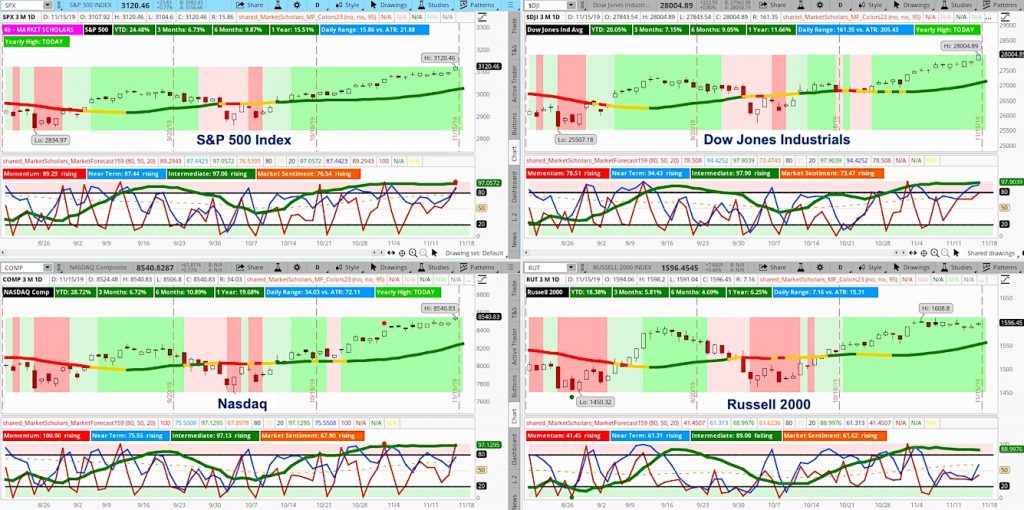
The S&P 500 Index INDEXSP: .INX produced an overbought cluster with all three Market Forecast lines closing in the upper-reversal zone.
This occurred on the 27th day of the near-term line closing in the chart’s upper half – well beyond the typical timeframe.
It appears few people want to be caught not being bullish if and when Phase One of the expected trade deal between U.S. and China gets announced.
The last time we had a roughly 8% move (without any 1% pullbacks) on the S&P 500 Index when the VIX Volatility Index INDEXCBOE: VIX was around 20 (and 100% of $VIX3MO) was coming off the early June low.
Immediately after the June options expiration, we got a 23% Fibonacci retracement before the new intermediate trend continued. There is a similar scenario setting up right now.
The S&P 500’s Heikin Ashi weekly candle closed above the prior week’s high for the third straight week – again, similar to last June. This is an uncommon occurrence and generally leads to a week or two where the new week’s high is unable to get above the prior week’s high. See video and summary analysis below.
Get market insights, stock trading ideas, and educational instruction over at the Market Scholars website.
Stock Market Video – for week of November 18, 2019
According to multiple intermarket relationships, risk appetite suggests that despite the extreme near-term overbought condition, we are closer to the beginning of a bullish long-term move than we are the end of one.
Summary: For a third consecutive week, the S&P’s near-term posture remains strongly overbought – this time culminating the week with a gap to the upside and above-average trading range and volume heading into options expiration. We have produced a ~8% move without any 1% pullbacks since early October.
This is a similar technical environment to June where we finally produced a 23% retracement after a similar short-term “blow-off”-type gap immediately preceding options expiration. As a result, look for some near-term choppiness over the next week or two as we maintain a bullish posture but are most likely unable to produce new weekly highs before we break out again to the upside.
Twitter: @davidsettle42 and @Market_Scholars
Any opinions expressed herein are solely those of the author, and do not in any way represent the views or opinions of any other person or entity.

 Rolling Over At Key Fibonacci Level?")


