S&P 500 Weekly Market Outlook & Technical Review (July 29)
Here’s a look at some key stock market indicators and emerging themes that we are watching:
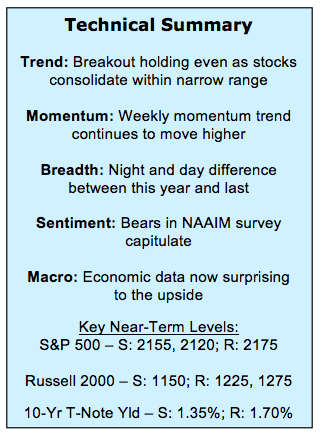
Stocks Consolidating Recent Gains – After breaking out to a new high, stocks have settled into a narrow short-term trading range. While at times frustrating, this consolidation allows stocks to work off some of the overbought conditions that emerged during the surge off of the post-Brexit lows. Overbought conditions can be relieved either through time or through price or, as may be the case this time, a little bit of both.
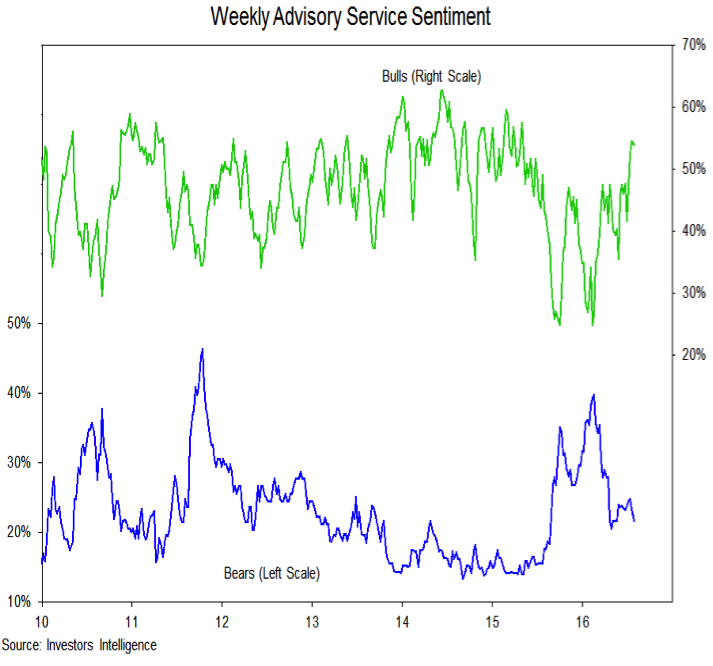
Seeing Pockets of Excessive Optimism – Arguing for the likelihood of some near-term price retracement is the evidence that near-term optimism is moving toward excessive levels. The latest data from NAAIM shows the bearish contingent has capitulated. Advisory service optimism, however, has not yet risen to worrisome levels.
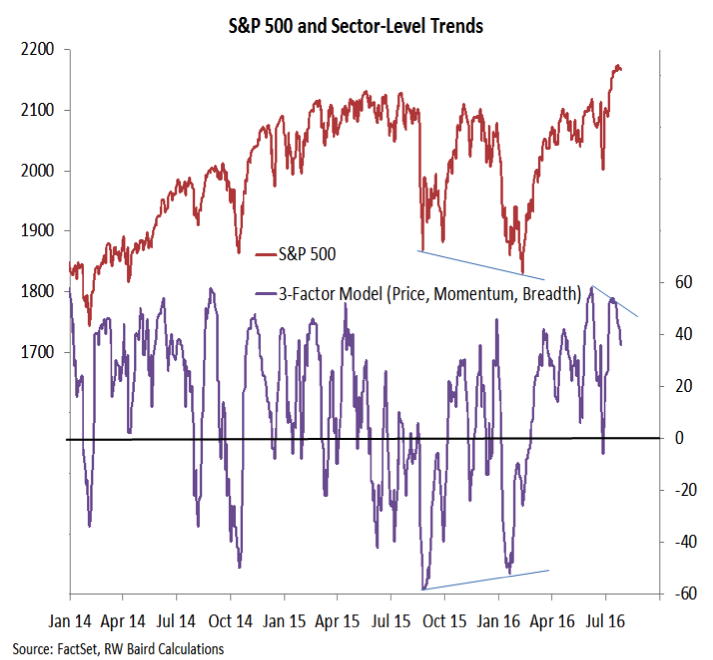
Breadth Trends Remaining Firm – The consolidation seen at the index level is also showing up in short-term sector-level trends. While this shorter-term measure of breadth has pulled back slightly, the percentage of industry groups in up-trends has continued to improve. If breadth trends remain robust, the path of least resistance over the intermediate term is likely to remain higher.
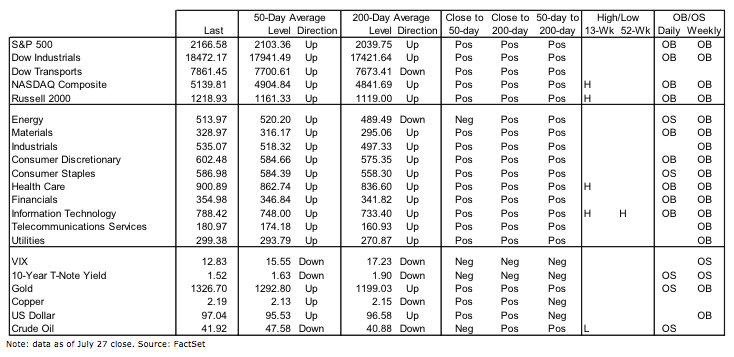
Stock Market Indicators – Indices & Sectors (click to enlarge)
S&P 500 Index
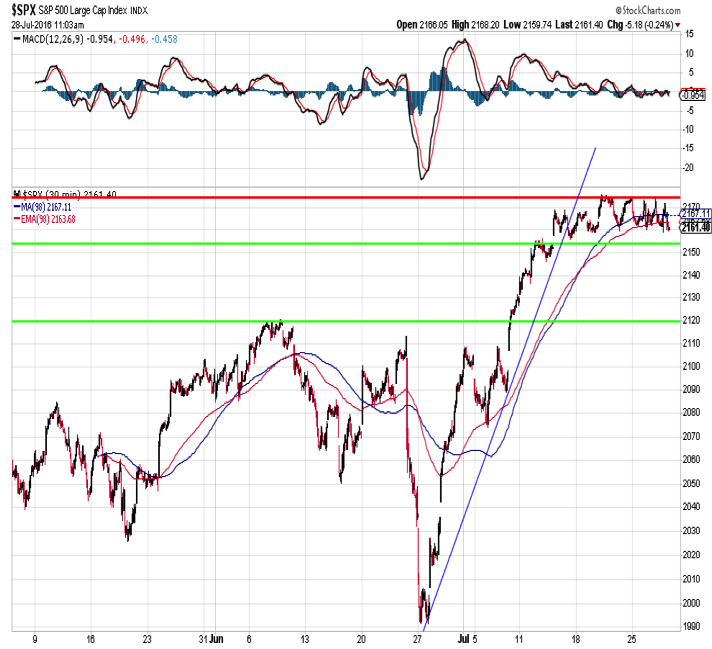
After a sharp bounce off of the post-Brexit lows that carried it to new all-time highs, the S&P 500 has settled into a narrow trading range over the past two weeks. Resistance has emerged near 2175 and support is near 2155. More significant support is near 2120, and given the increase in near-term optimism that has been seen, this might make for a more reasonable base from which the next leg of the rally emerges.
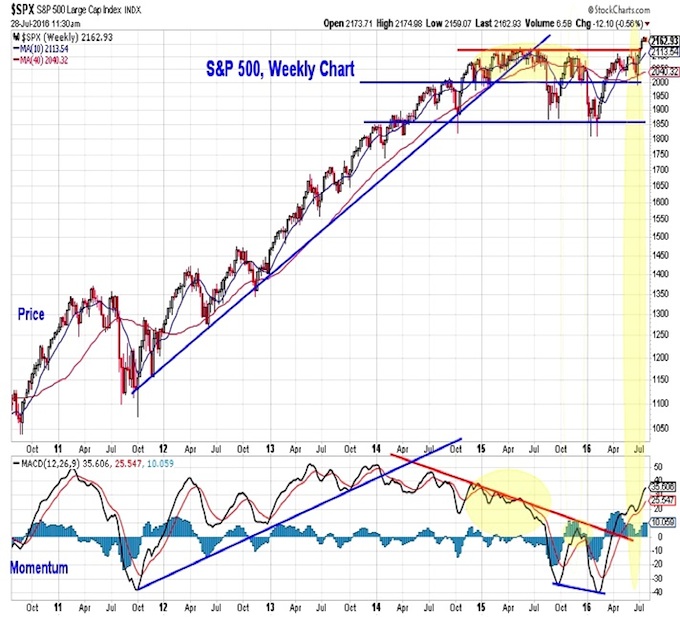
From a longer-term perspective, the consolidation looks like a healthy pause following an upside breakout. Momentum continues to improve, suggesting the path of least resistance remains higher over the intermediate term.
Investor Sentiment
Investor optimism in stocks is becoming more widespread. This week’s NAAIM exposure index rose to 101, the highest level since December 2013 as the bearish extreme capitulated (from -100 two weeks ago to 0 this week). The NDR trading sentiment composite has moved to a sell signal and last week saw an 11-handle on the VIX. Excessive optimism is not universal however. The AAII survey scarcely shows more bulls (31%) than bears (28%). We are also keeping a close eye on the Advisory Services sentiment data published by Investors Intelligence. Bulls closer to 60% (currently 54%) and/or bears in the teens (dropping this week to 22%) may be a signal that risks of a more significant pullback in stocks have risen
Sector Trends & Market Breadth
The rally to new highs on the S&P 500 was accompanied by a divergence by our sector-level trends indicator. This is consistent with a continued consolidation at the index level, although the deterioration in sector-level trends at this point has been relatively modest. More significant weakness at the sector level would increase the risk of a sharper pullback in the S&P 500.
continue reading on the next page…

