Key Stock Market Takeaways: Stocks move toward new highs, though current rally participation leaves room for improvement. See the S&P 500 (INDEXSP: .INX) market breadth charts below.
Investor sentiment is mixed as near-term pessimism has faded. Central bank tailwind is bullish for stocks.
In the wake of the recent shifts in by the Fed and other central banks, our weight of the evidence has been upgraded from neutral to mildly bullish (Favorable Fed Turns Evidence Bullish).
While that suggests a more encouraging backdrop fundamental backdrop for stocks, it does not erase some lingering risks that have emerged as the S&P 500 has moved back toward its highs of the year (and potentially into record territory).
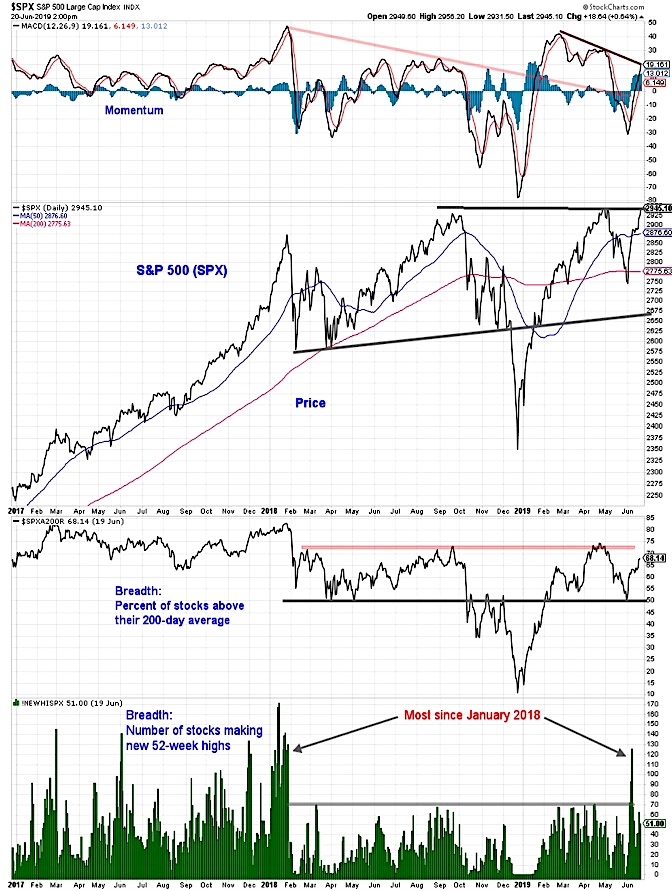
All else being equal (which it rarely is), new highs are an indication of strength and it is more bullish for stocks to make new highs than to not make new highs. One of the improvements seen earlier in this month’s rally was an expansion in the number of individual stocks making new highs (the most since January 2018).
This week’s foray by the S&P 500 toward new highs has been accompanied by a further expansion in the new high lists for the NYSE and NASDAQ. This is offset by momentum that has waned over the course of the first half of 2019 and relatively fewer stocks on the S&P 500 that are trading above their 200-day averages (this was above 80% in January 2018 and close to 75% in September 2018 and April 2019 and now has struggled to even get back to 70%).
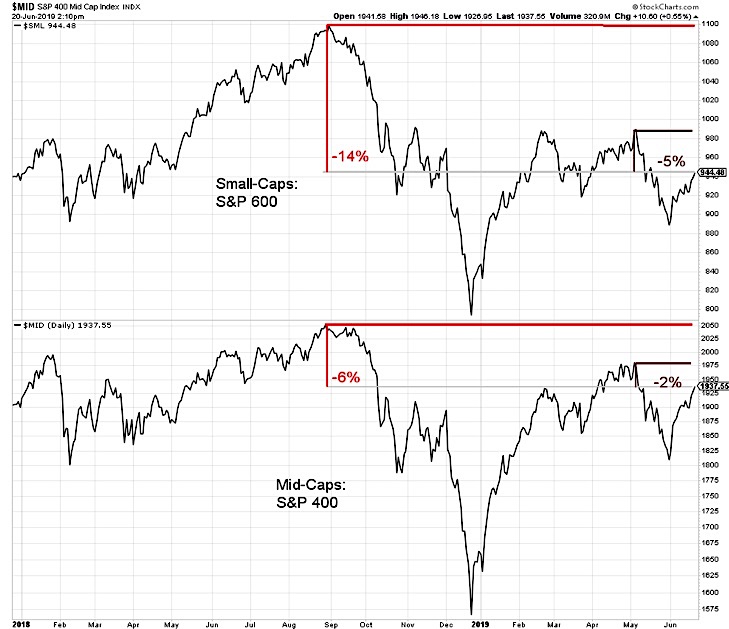
The S&P 500 is above its 2018 peak and is challenging its high from earlier this year. The same cannot be said for its mid-cap and small-cap counterparts.
The mid-cap S&P 400 is 2% below its 2019 high and 6% below its 2018 peak. The small-cap S&P 600, meanwhile is still 5% from its 2019 high and 14% below its 2018 peak.
The Value Line Geometric Index (which is proxy for the median stock in the Value Line universe) is 4% below its 2019 high and more than 10% from its 2018 peak. New highs on the S&P 500 are not accompanied by new YTD highs from the S&P 400 and S&P 600 would suggest that breadth remains less than bullish. We also continue to see a lack of confirmation when looking at things from a global perspective. Nearly two-thirds of foreign markets remain in downtrends (defined by 200-day averages that are falling.
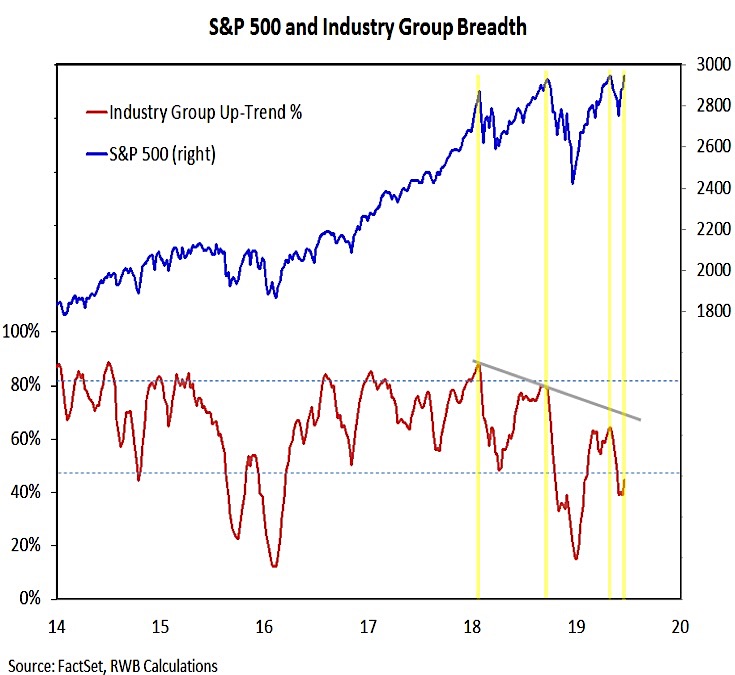
Weakness at the small-cap and mid-cap level is weighing on our industry group breadth indicator. Successive peaks in the S&P 500 have come with fewer and fewer industry groups in up-trends.
Even with this week’s gains, this indicator is poised to improve only modestly (from 39% last week to the mid-40s this week). Its May 2019 high was 65% and in September 208 it was at 80%. While it is starting from a low level, a broadening rally could help fuel rapid improvement. That would be encouraging evidence that the breadth backdrop is turning more bullish. While we would prefer to see breadth pulling the S&P 500 higher, at this point we would settle for the opposite. What would be unwelcome would be gains in the S&P 500 that are accompanied by deteriorating market breadth.
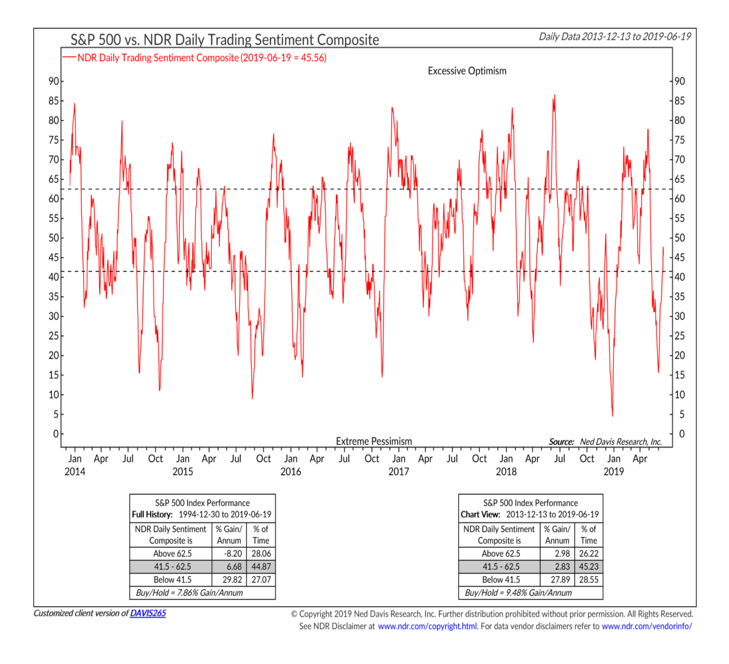
While watching rally participation in terms of stock market breadth, we also want to keep an eye on participation in terms of investor sentiment. Seeing more bears than bulls on this week’s AAII survey is an encouraging sign of continued skepticism, while seeing bulls on the II survey moving back above 50% suggests optimism has returned. With conflicting signals form the individual surveys, we like to lean on sentiment composites.
The NDR daily sentiment composite this week moved out of the excessive pessimism zone and back into neutral. Over the past few years, the bulk of the gains in the stock market have come when this composite has been signaling excessive pessimism. That near-term tailwind has run its course for now.
While we can speculate on whether the Fed will cut rates in July (and if so, by how much), central bank policy has already shifted in favor of stocks. An interest cut by the Fed, especially if the economy is able to avoid recession (which we expect to be the case) would add to the bullish central bank backdrop.
Over the past 30 years, all of the net gains for global stocks have come when more than half of the central banks around the world have been cutting interest rates. Even without the Fed taking action, the last move by 19 of 34 global central banks was to cut interest rates.
Twitter: @WillieDelwiche
Any opinions expressed herein are solely those of the author, and do not in any way represent the views or opinions of any other person or entity.


