 By Alex Salomon
In the finale of my 3 part series on Apple’s (AAPL) upcoming earnings report, I’d like to dig into the numbers and offer some analytical ideas (and even opinions!) on where AAPL stock price may be heading into their 1Q earnings report (January 23, 2013) and into month’s end. Yes, finally some AAPL price targets! A quick note of thanks to fellow SIM contributor Jeff Wilson for his technical input during an email conversation on Friday.
ALSO READ Parts 1 & 2: An Earnings Preview and A Look Under The Hood
To get at a consensus AAPL price target, I will run the math on 3 different types of methodologies:
1) Technical Analysis (TA)
2) Fundamental Analysis (FA)
3) Historical earnings reaction to strong beats
1. Technical Analysis AAPL price target (using daily and weekly time frames):
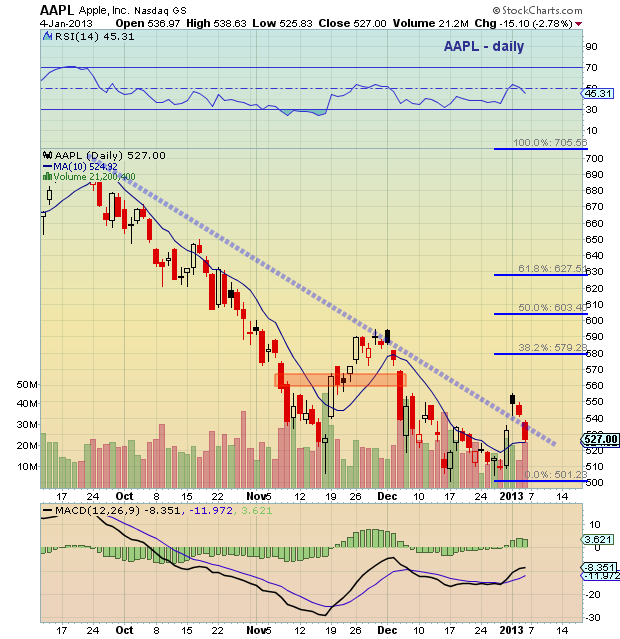
The chart below shows Apple on a daily time frame and highlights the upside breakout and subsequent fail back at the end of the week. Note, however, that due to recent sentiment, this could be a deeper “kiss back” to shake out nervous hands. Either way, the price action Monday (and next week) will be very important. I personally think the stock needs to close green on Monday and follow through higher by the tail end of the week.
If Apple can close green and push higher, it should be magnetized to the 38.2% Fibonacci level ($580), followed by the 50.0% Fib level ($603), putting a $600+ price on the stock by January 31. In full disclosure, I do not have a current position in Apple.
BUT IT ALL STOPS and bears review on a daily close below $523
So, if $600+ is an AAPL price target by month’s end on a TA basis, where’s the trade?
With the natural floor at the break of the trend line, and the current price residing just above the 10 day sma ($525), I would use a close below $523 to define risk. That leaves a Risk/Reward of $523 vs. $600. Another important area/hurdle is 560-565. If we were much closer to earnings, I’d venture to use that zone as the make or break. Since we are too far out, just use it as a mental target: Apple must convincingly digest $565 to push its way to $600+ before earnings. Alternatively, it could stay there for a while (digesting the break out) while waiting for earnings.
In short, from TA, one could consider trading Apple two ways:
- Short-term traders with freed up funds could buy now with a firm stop on a close below 523 or sustained weakness on Monday (i.e. an inability to reclaim the descending down trend line). Or on the flipside, wait for a return to $560/$565 and reload on a break above $570 for $600 target
- Weekly traders with patience and 20 days in front of them, could acquire above $535 with a $10 trail stop until $560; then trail stop by $15 and if it breaks up, keep $600 target.
Also, considering the current risk/reward profile ($523, weak close, $70 upside), I would book profits and AVOID earnings IF we meet $600 BEFORE earnings.
2. Fundamental Analysis AAPL Price Target (using $15.25 EPS from my earlier column, giving TTM $45.54, vs. consensus of $43.75).
Consider the following:
- Based on realized prior EPS TTM vs. estimated TTM including Q1, $45.54 (2013) vs. $35.11 (2012), 30% growth TTM
- Estimated EPS QoQ: $15.25 (2013) vs. 13.87 (2012), 10% growth
- Estimated Revenues: $57,723MM (2013) vs. $46,333 (2012), 25% growth
We can use these numbers to extrapolate classic valuations based on upcoming earnings:
- Keeping with a current median P/E of 13, the target is $592
- Keeping with a 5yr rate of decreasing median P/E, at 12, the target is $546
- Keeping with previous qtr. P/S of 4 for TTM, the target is $664
- Keeping with a 5yr avg. P/S ratio of 3.5 for TTM, the target is $585
- An average of these targets point to $597
I prefer to use the 5 year trending ratios, but basically, what these metrics are telling us is that Apple would be fairly valued on its own historical performance right around $600.
3. Historical reaction to strong earnings (and price appreciation potential):
My whole scenario is based on a beat ($15.25 vs. $13.46 consensus vs. $11.75 guidance). So really, a 30% beat from Company guidance. With this vantage point, let’s revisit prior earnings, looking at price from 18 days out (13 trading days), along with the price the day of, and day after (all percentage based).
The last large beats were:
- Q2, 2012: +22%. Price on close 4/24: 560.28 ; Highest on 4/25: 618.00 ; Price on 4/05: 633.68
- Q1, 2012: +36%. Price on close 1/24: 420.41 ; Highest on 1/25: 454.45 ; Price on 1/06: 422.40
- Q3, 2011: +33%. Price on 7/19: 376.85 ; Highest on 7/20: 396.27 ; Price on 7/01: 343.26
It is fairly easy to extrapolate potential ranges from these numbers:
In short, if we repeat Q2, 2012… well, let’s not!! That would mean a drop into earnings, which would indicate “staying out of Apple into the earnings.” However, if we repeat Q1, 2012 and Q3, 2011, the current range of $530 to $600 remains largely in play.
CONCLUSION:
I largely believe that Apple will report a monster quarter, but I am also weary of its current valuation and stock pricing. The company is still in an enviable, even, to some extent, monstrous growth period, but the stock is reaching its own plateau, for the time being. I am compelled by the current trade setup as outlined above and am pleasantly surprised to see that all 3 methodologies are pointing to the same AAPL price targets: buy now, on a super tight leash, for a decent 10% reward… but if it breaks down, it is not worth being involved in until the $560-565 congestion zone is taken out.
Stay tuned, as I will continue to revisit Apple and earnings and new products!! Thanks for reading and trade safe!!
Twitter: @alex__salomon @seeitmarket
No position in any of the securities mentioned at the time of publication.


