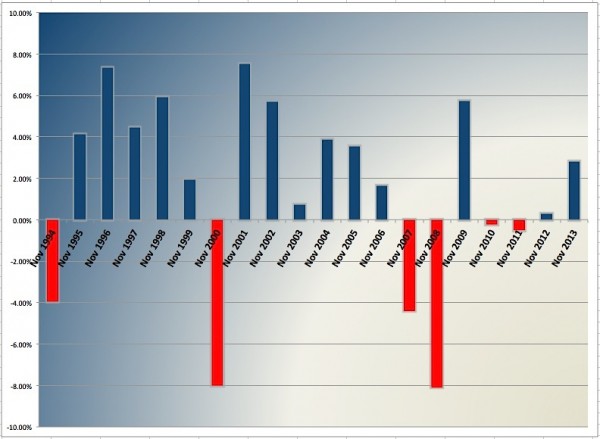
The month of November has been good to investors from a seasonal perspective. In fact, over the past 20 years November has seen the S&P 500 rise 70 percent of the time. But what I found even more interesting was that November is a bit more volatile in terms of gains and losses over that same time period.
In short, there isn’t much room for neutrality with the November stock market. It’s either really bullish or really bearish. Let’s run through some recent numbers, then look at some charts. Note that the S&P 500 was used for this study, and it spans the past 20 years.
On the bullish side, here’s what you need to know:
- The stock market has been up 70 percent of the time since 1994 (that’s 14 of the past 20 Novembers for those keeping score at home).
- The average gain when November rises is 3.97%
- And the overall average gain/loss for November is 1.52%
On the bearish side, here’s what you need to know:
- November has been down just 6 times in the past 20 years (30 percent)
- The average loss when November falls is 4.20%
- November has been down 4 of the past 7 years
November Stock Market Performance – 20 years charted:
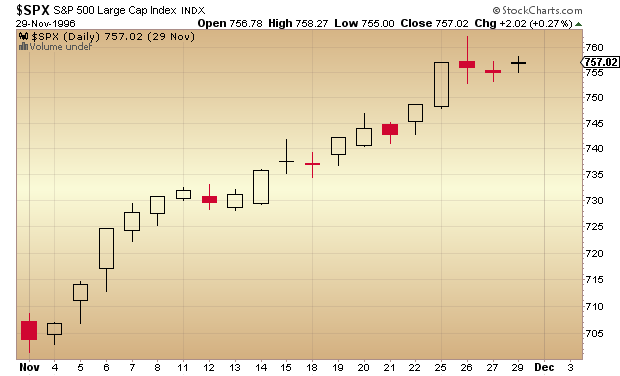
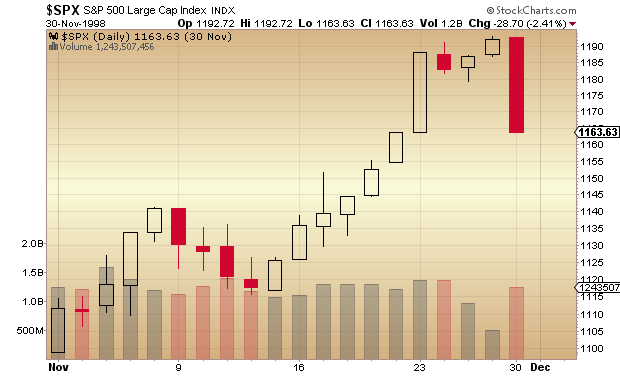
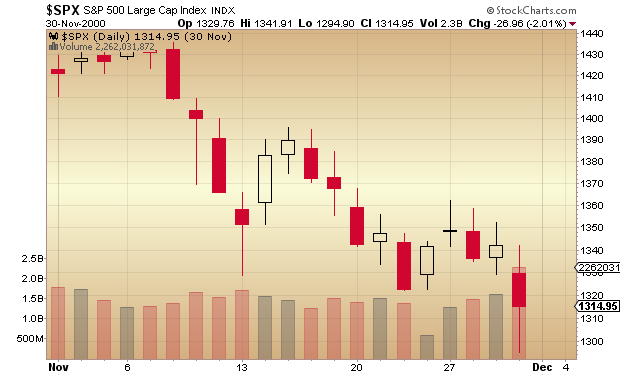
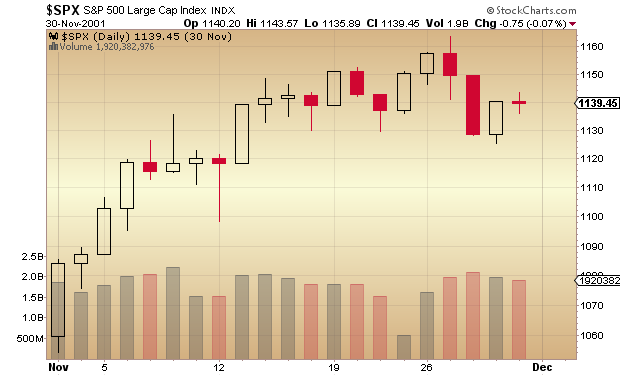
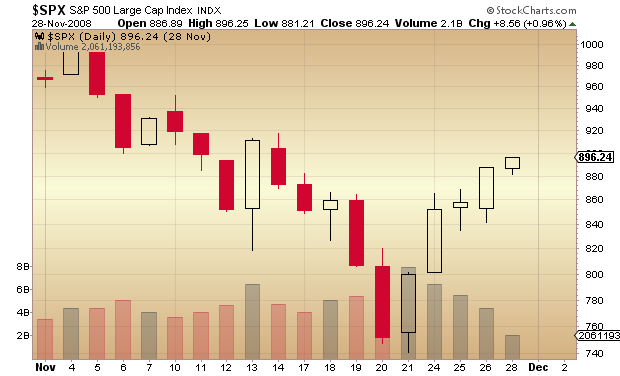
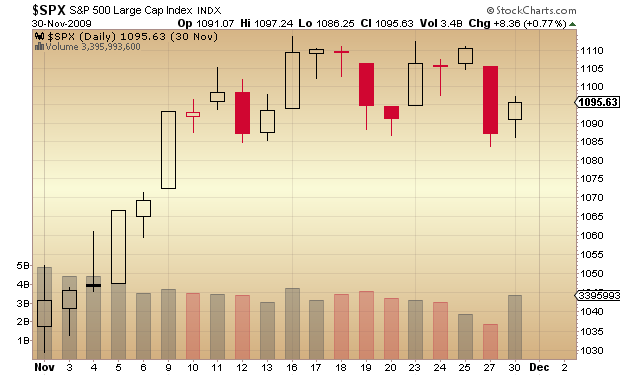
Here are a few Novembers to remember, in charts:
November 1996 +7.34%
November 1998 +5.91% …even with that late month selloff
November 2000 – 8.01%
November 2001 +7.52%
November 2008 – 8.09%
November 2009 – 5.74%
Here’s a few more items to consider. The S&P 500 has rallied over 10 percent from the October lows. With this in mind, it will be interesting to see if stocks have more gas in the tank this month. November tends to make bigger moves one way or the other, but market breadth has weakened a bit with the latest rally. With this in mind, it seems fair to say that this year’s [November] performance may hinge on the markets ability to consolidate gains in a timely fashion. Thanks for reading.
Follow Andrew on Twitter: @andrewnyquist
Any opinions expressed herein are solely those of the author, and do not in any way represent the views or opinions of any other person or entity.

