We’re watching the natural gas market closely this month with the possibility that price has set a long-term low.
This post describes what traders of natural gas futures and the ETF should expect if nearby support holds… and if it doesn’t.
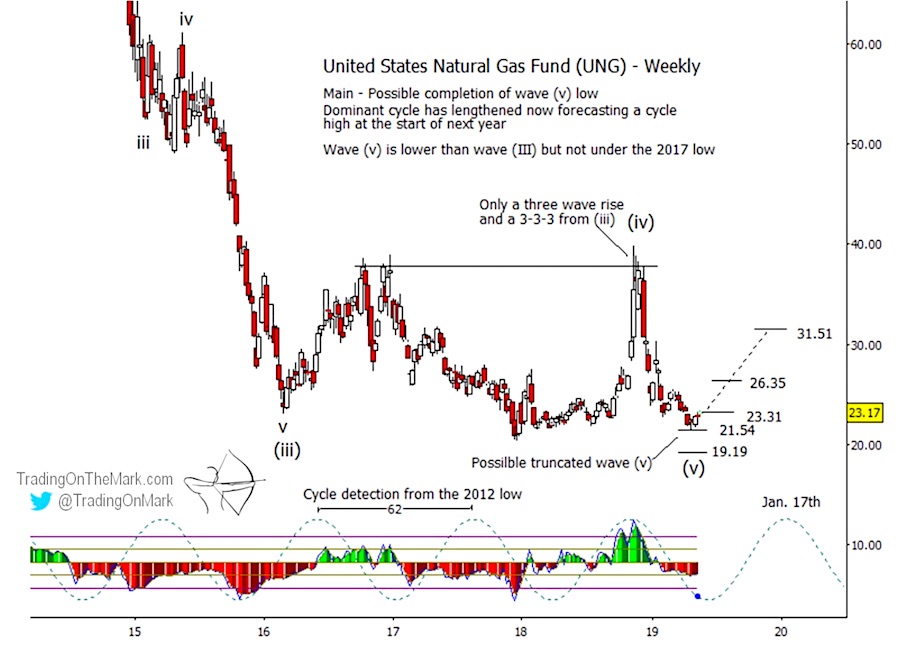
When we wrote about the United States Natural Gas Fund (NYSEArca: UNG) in February, we indicated that support at 21.54 could be the basis for a truncated wave (v) low.
The updated chart below shows the level being tested and producing a small initial bounce that could turn into more.
In the bigger picture we’re looking for completion of a downward five-wave impulse that began in 2008.
At present the main requirement for pattern completion is for the chart to put in a smaller five-wave decline from last November’s high – a requirement that has been satisfied. Price doesn’t necessarily have to go beneath the 2017 low.

In addition to seeing a formally completed Elliott wave count, we note that a 62-week price cycle is on the verge of an upward inflection. The faster 36-week cycle we showed in the previous article has already begun its up-swing.
Initial evidence of an upward reversal would come with a break and weekly close above nearby resistance at 23.31. If price takes off, then 26.35 and 31.51 could serve as targets during a climb.
On the other hand if price breaks beneath 21.54 we could see the chart print a true lower low, possibly near support at 19.19.
With increased volatility in the markets, trading with the right charts gives you a real edge. For the rest of May we’re making an introduction to Trading On The Mark available to new subscribers with a big 20% spring price reduction. Just use the coupon code TULIP on the “Subscribe” page to claim your savings.
Twitter: @TradingOnMark
The authors may have a position in the mentioned securities at the time of publication. Any opinions expressed herein are solely those of the author, and do not in any way represent the views or opinions of any other person or entity.


