 What do investors make of the record new low levels seen on the CBOE Options Equity Put/Call Ratio? Is market sentiment getting too complacent? Is a major stock market peak imminent?
Recently on my Tumblr blog, I took a closer look at this. In short, the consensus is the low level suggests that market sentiment is growing extremely complacent. Well, I didn’t find that.
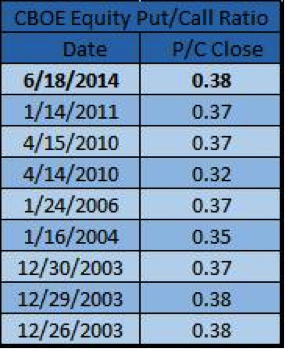
Looking at all the other times the ratio was this low, I found that only once did it lead to immediate weakness (April 2010). The other times simply lead to either higher prices or a choppy market.
My conclusion: the sample size is just too small to conclude this is indeed a bearish event, so don’t take it as bearish! As well, more research was necessary to provide more meaningful context to current market sentiment.
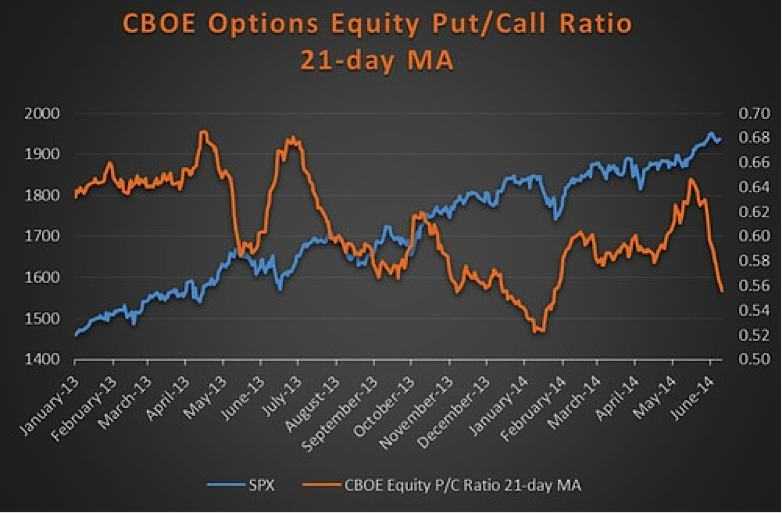
I’d much rather look at the 21-day moving average of this ratio. The thing that is important is the overall trend and if it is trending lower, that is usually bullish. Well, this ratio is indeed ‘low,’ but still trending lower. Keep it simple.
Now, I keep hearing how bullish everyone is and how that can be worrisome. I don’t disagree, as there is much more optimism versus what we’ve seen throughout this bull market. But is that reason enough to expect the worst?
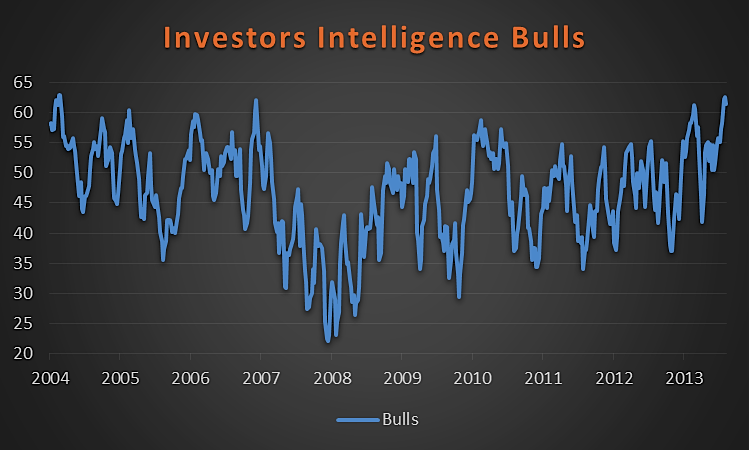
Looking at the Investors Intelligence poll shows the bulls have been above 60% for three straight weeks for the first time since December 2004. This is very extreme market sentiment, yet the S&P 500 (SPX) in early 2005 had a brief pullback, but then slowly moved higher into the end of the year. It wasn’t a huge year for the bulls, but it sure wasn’t a major sell signal either.
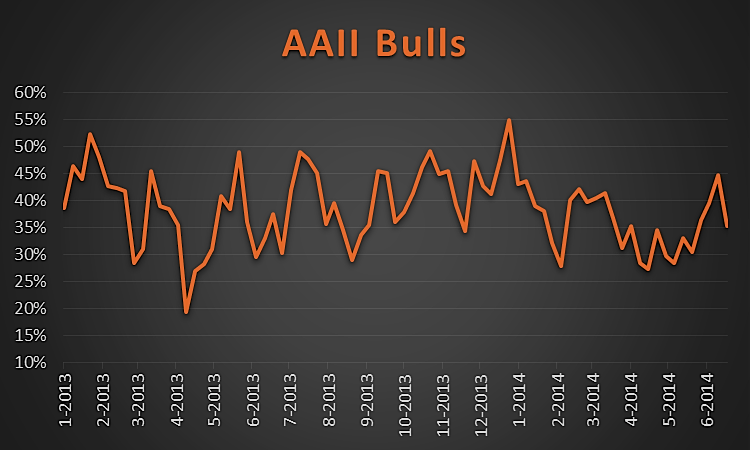
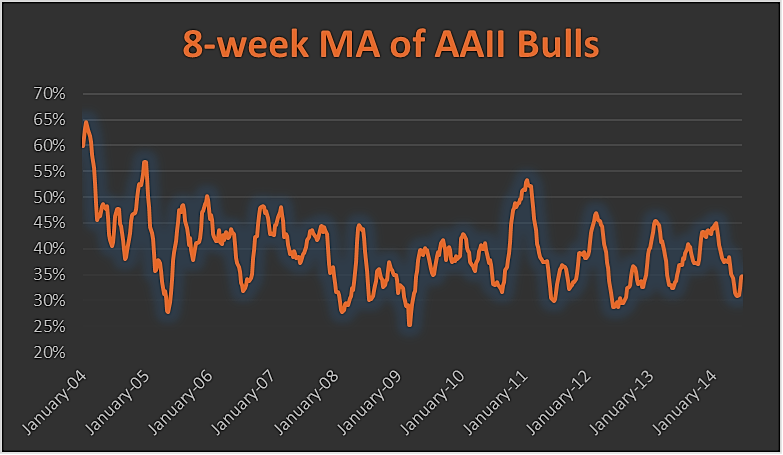
Now, the Investors Intelligence poll looks at what newsletters think – while the American Association of Individual Investors (or AAII) poll looks at individual investors. I find this fascinating, as they continue to show their doubts. In fact, bulls here are down to just 35%, nowhere close to the recent peak of 55%. This is pretty much the middle of the range the past 18 months.
Taking a longer-term look at this, its 8-week moving average is near the lower end of the range. Maybe everyone isn’t so bullish?
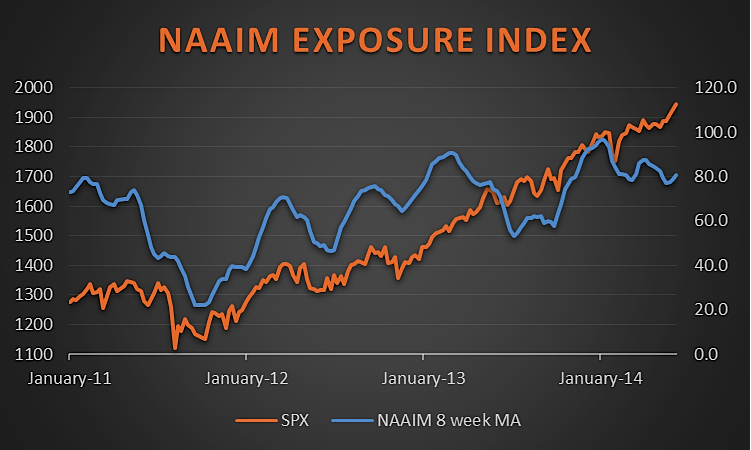
I also like to look at the National Association of Active Investment Managers (NAAIM) Exposure Index, as this is a poll of what real money managers are doing. The 8-week moving average of this one is high, but trying to curl higher. Historically, this trends with the market, so a higher move could be a welcome sign.
Don’t get me started on the VIX being low as complacent. The VIX tends to stay low for years and we’ve really only been in this recent low volatility world for 2.5 years. We could very well see the VIX stay beneath 20 for a few more years. A low VIX isn’t by itself bearish. In fact, bear markets happen when the VIX is high – like above at least 30, if not much higher. No one truly knows when it will spike, but trying to guess that is nearly an impossible game.
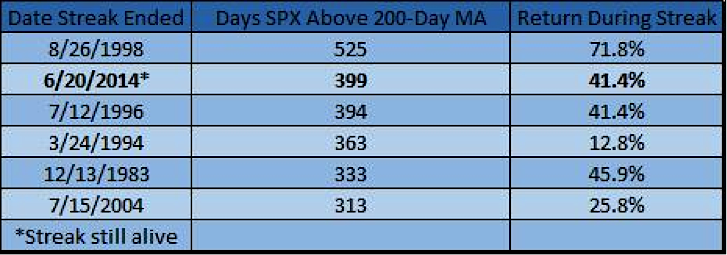
In the end, only price pays. To me, things still look good. New highs are new highs after all. The SPX has closed above its 200-day moving average for 399 days in a row. This is no doubt a lot, but the all-time record is 525 – so it isn’t out of the question for this rally to continue.
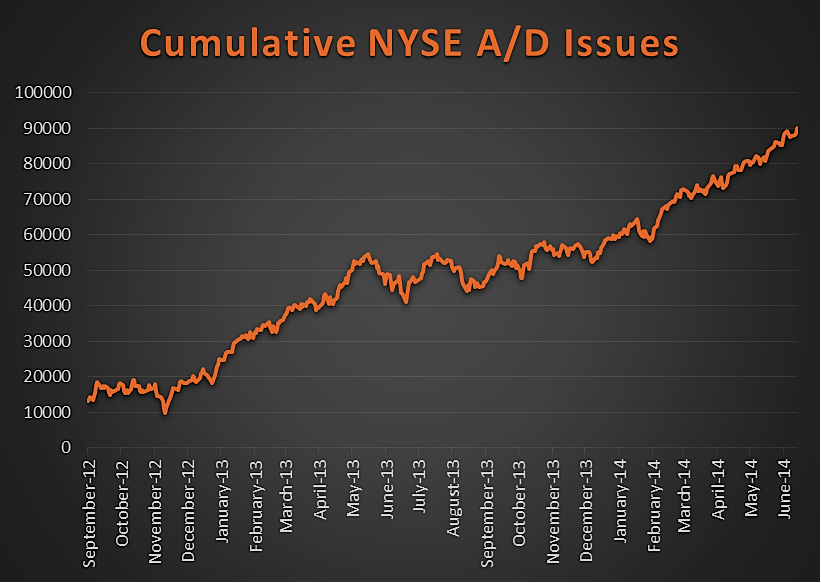
Also the cumulative NYSE advance/decline issues continues to make new highs. Historically, this tends to top out ahead of the SPX. As long as it keeps making new highs, this is firmly a plus for the bulls.
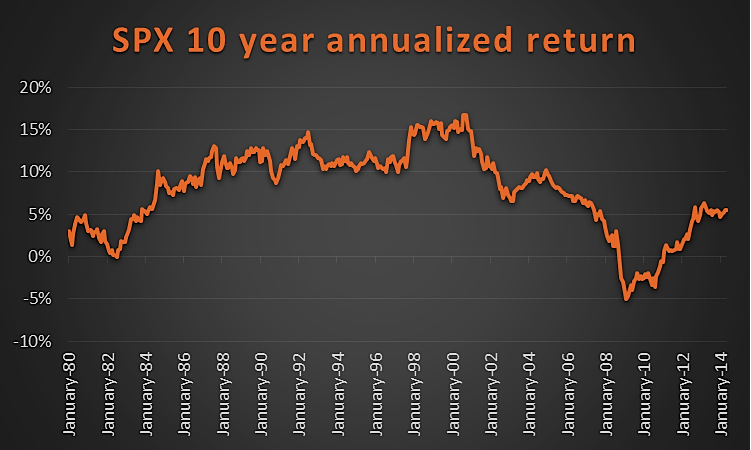
Lastly, check out the 10-year annualized return on the SPX. It sits right about 5%, still the lower end of things going back to 1980. To say we are super stretched here just isn’t true.
Can this bull market continue? I sure think it can, even though we are seeing market sentiment tick higher. Good luck in your trading!
Any opinions expressed herein are solely those of the author, and do not in any way represent the views or opinions of any other person or entity.

