 By Alex Bernal
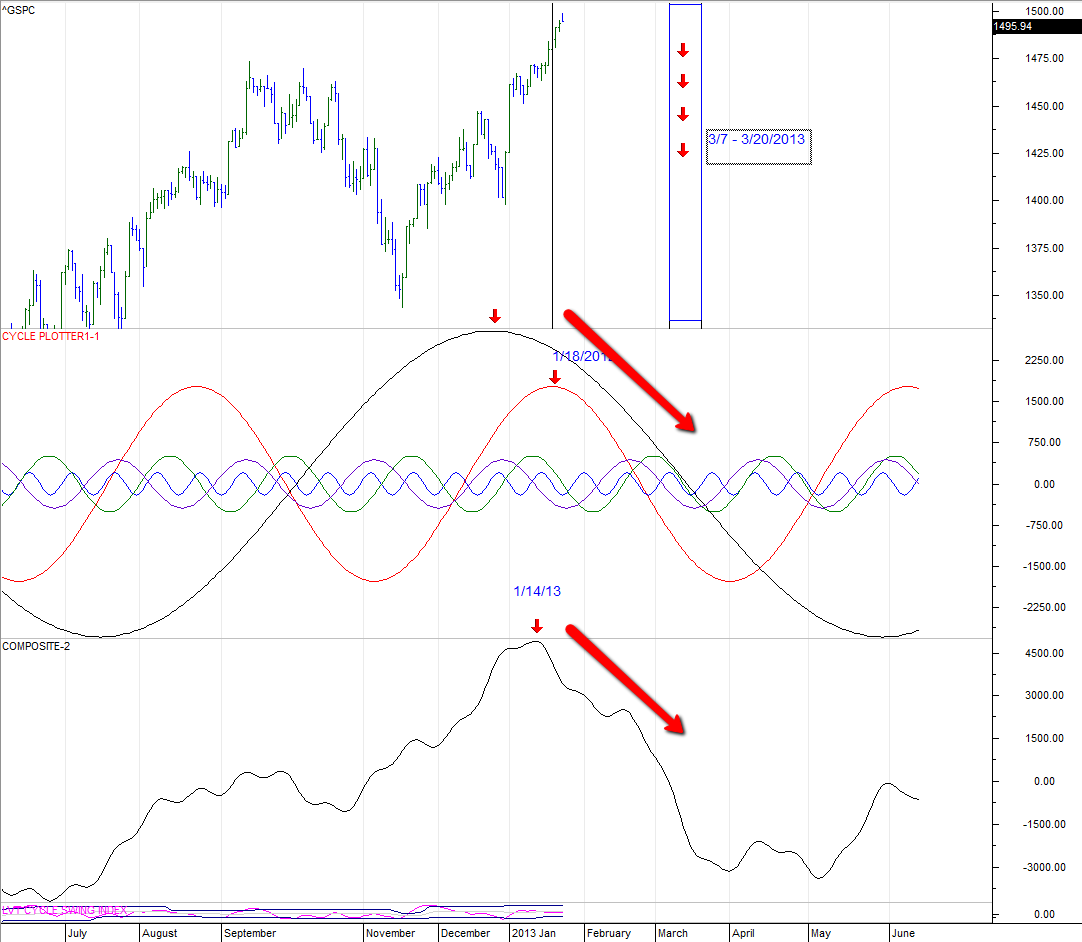
As an update from my recent article on market cycles, I wanted to feature some of the additional cycle tools that I use to analyze markets. In the chart below, I have isolated the top 5 market cycles ranked by statistical significance and amplitude strength.
The current market cycles are as follows:
1. 100-Day / Amplitude 1800.56
2. 12-Day / Amplitude 207.42
3. 34-Day / Amplitude 519.50
4. 220-Day / Amplitude 2827.76
5. 36-Day / Amplitude 449.63
Additionally we have consolidated the standing waves into 1 composite wave that is used to forecast the overall projected movement of the market. This is different from the previous post in that we are not targeting any 1 or 2 of the strongest market cycles but rather looking at all the cycles underlying the S&P 500. You can see that the composite cycle peaked on 1/14/2013 and has been suggesting a trend reversal. But what is keeping the market up?! Well, it’s easier to see the reason by analyzing the independent cycles. You can see the 100-Day cycle in red has peaked on 1/18/2013 and with the 220-day cycle suggest a move down is imminent. *Also we have isolated a particularly significant time frame in which all major cycles are in a down swing 3/7/2013 -3/20/2013. This will be a time that we believe will have very strong downtrend for the index.
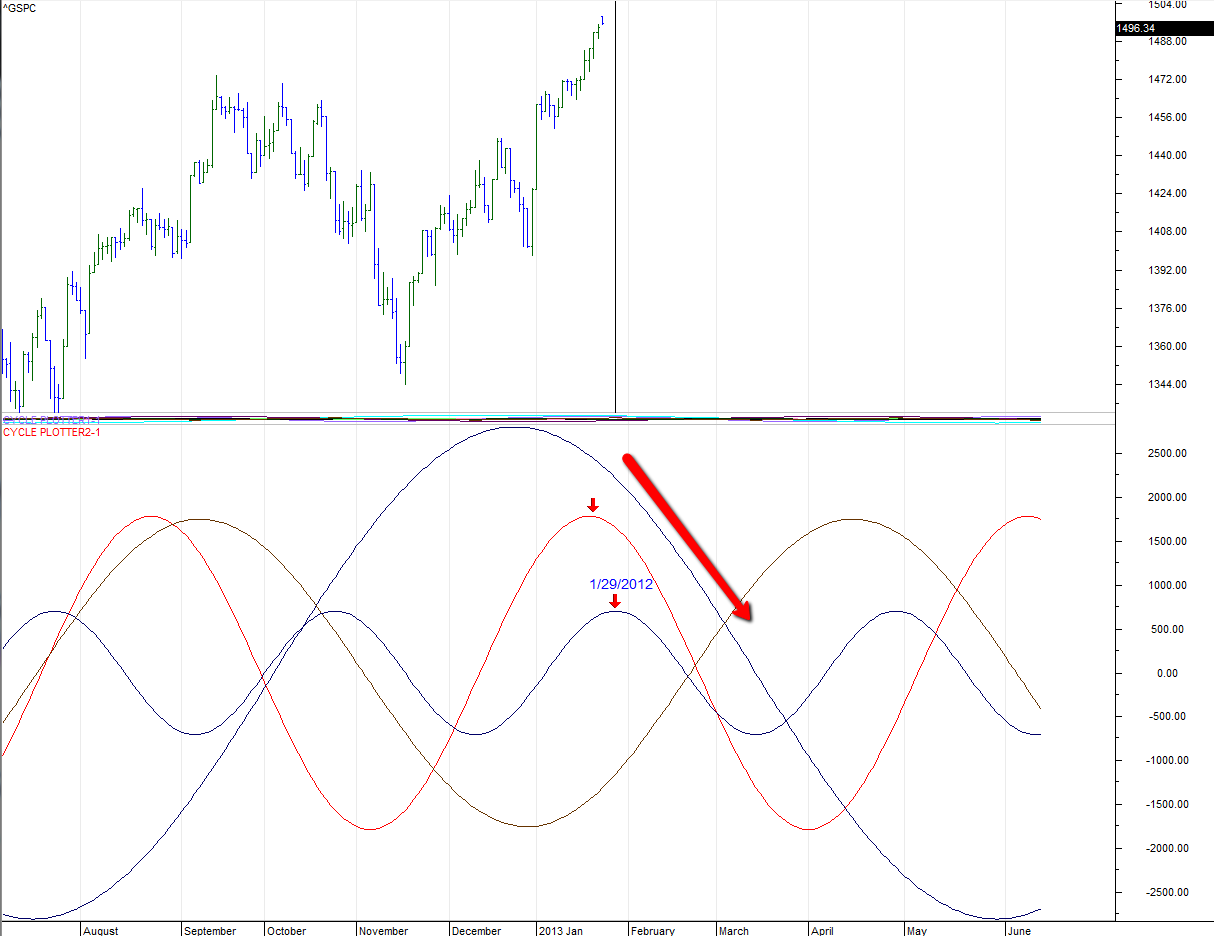
We can go even further and add yet another major market cycle in terms of amplitude strength (but less statistically significant) which is the 47 day cycle / with 550.37 amplitude to see yet another cycle that is holding this market in its up swing that peaks 1/29/2013. All these cycle plots are anchored to the May 6, 2010 flash crash low.
Disclaimer: This in no way constitutes investing advice. All of these opinions are my own and I am simply sharing them. I am not trying to convince anybody to do anything with their money. I am simply offering up ideas for the sake of discussion. As always, everybody is expected to do their own due diligence and to ultimately be comfortable with their own investing decisions. Any actions taken based on the views expressed in this blog are solely the responsibility of the user. In no event will Aether Analytics or its owner be liable for any decision made or action taken by you based upon the information and/or opinion provided in this blog.
Twitter: @InterestRateArb and @seeitmarket
Author currently is short OTM call spreads in S&P 500 options.
Any opinions expressed herein are solely those of the author, and do not in any way represent the views or opinions of any other person or entity.


