Today I want to run through a quick checkup on market breadth to see how the market internals are faring thus far this year. In short, not so good.
As I was checkup up on the market breadth this week, a quote I learned form the great Arch Crawford came to mind: “the troops are backing away from the generals” – AC
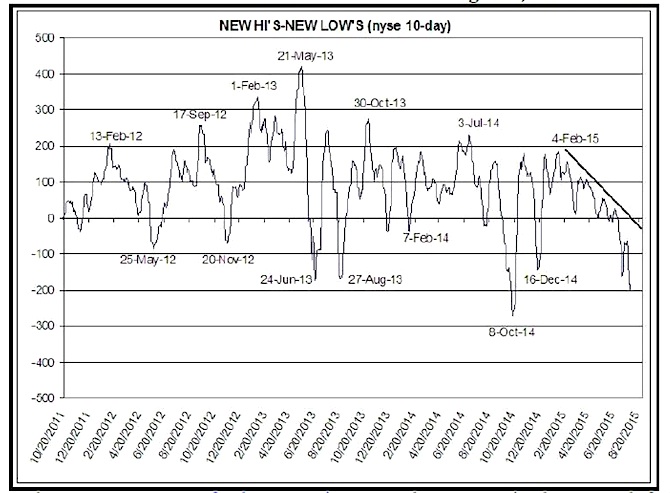
Below is a chart of the New Highs vs New Lows. There has been a massive diverence in this ratio throughout 2015. This means that less and less stocks are helping push (or keep) the overall market higher (or in this case, the S&P 500).
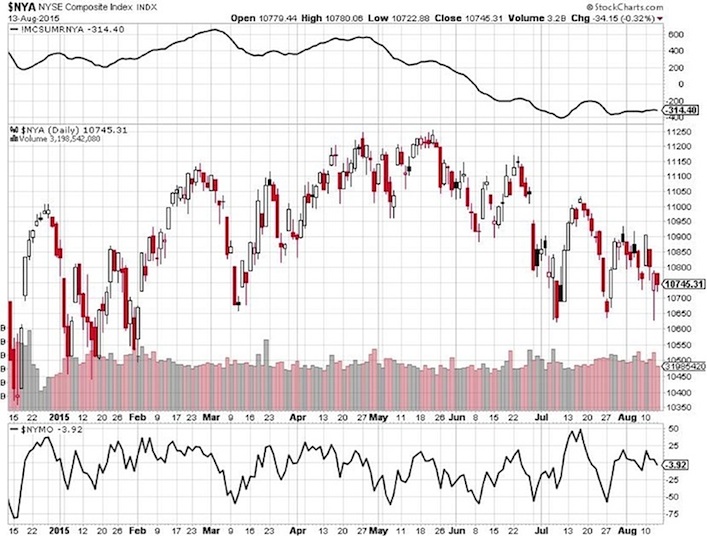
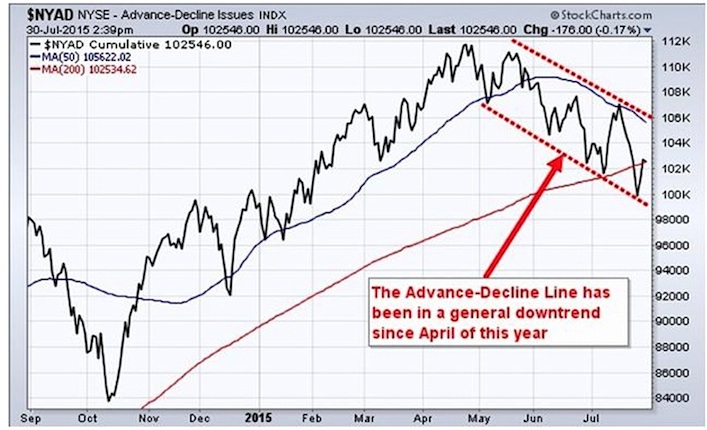
The McClellen index is another market breadth indicator that’s also showing the same weakness in the Advance Decline line.
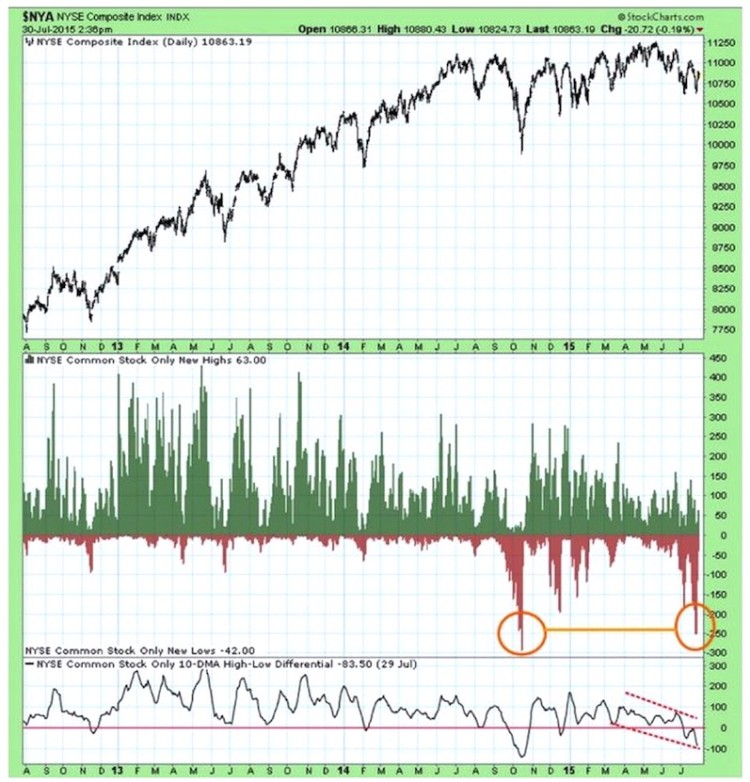
Yet another measure that looks quite ominous for stocks is the new high new low index. Here, you can see the most recent down spike is telling us that twice since 2014 a large number of stocks making new lows has increased.
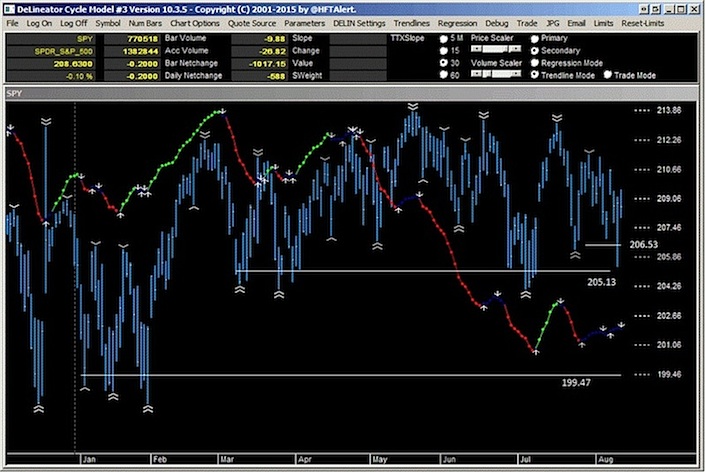
The final chart is one of my favorite breadth indicators. I like it because it shows us not only weak market breadth but can help us calculate the direction, duration and magnitude of the next trend in the stock market. It is HFTalert’s Seconadary Delineator. It is along the lines of the McClellan index but it uses what I believe to be a superior calculation method.
Steve Hammer of HFTalert sums up its recent reading on the S&P 500 ETF (SPY):
“We can see that there is a match between the Secondary moving progressively lower since April and the selling we are seeing into SPY. The declining Delineator during periods when price tests the highs, tells us that fewer and fewer companies are participating in each successive move toward the highs, that then subsequently fail. The risk here is down to 200 at this time.”
Thanks for reading and have a good weekend.
Twitter: @interestratearb
Any opinions expressed herein are solely those of the author, and do not in any way represent the views or opinions of any other person or entity.

