The Federal Reserve wasn’t quite as hawkish as investors expected.
The result: Treasury bond yields (interest rates) fell sharply.
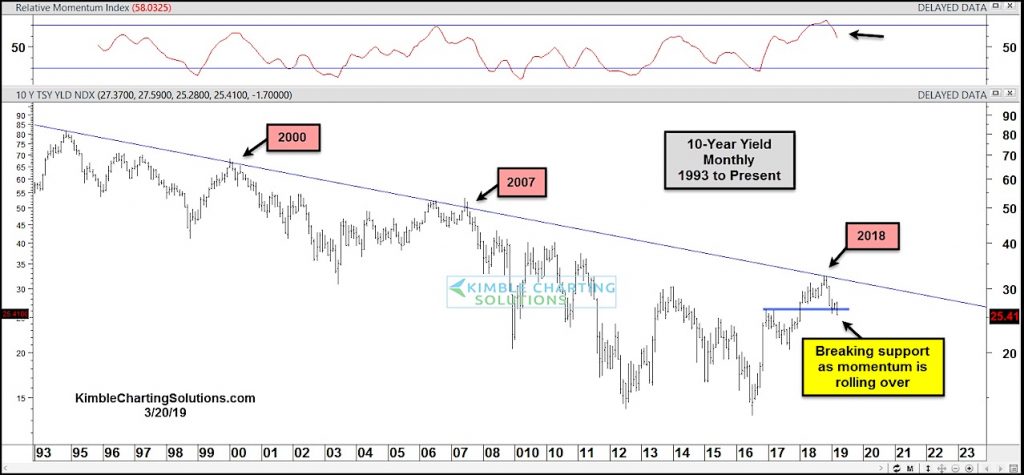
In today’s chart of the 10-Year US Treasury Yield, we highlight the reversal in rates that occurred late last year.
This wasn’t just any old reversal, though. It occurred along the same long-term downtrend line that produced reversals in years 2000 and 2007.
A closer look at the chart and it appears that 10-year yields are breaking short-term support. This is also occurring as monthly momentum rolls over from lofty levels
Interest rates can provide insight into the economy long before pundits begin reporting on it. Could the recent decline in interest rates be a signal that the economy is beginning to sputter? At a minimum, it’s worth watching! Stay tuned!
10 Year US Treasury Yield “monthly” Chart
Note that KimbleCharting is offering a 2 week Free trial to See It Market readers. Just send me an email to services@kimblechartingsolutions.com for details to get set up.
Twitter: @KimbleCharting
Any opinions expressed herein are solely those of the author, and do not in any way represent the views or opinions of any other person or entity.


