A great capitulation is underway in the U.S. equities market. And we’ve seen this type of thing happen only once before.
The chart in this article came from a discussion about broader signs of upside capitulation across the spectrum of investors in the latest Weekly Macro Themes report.
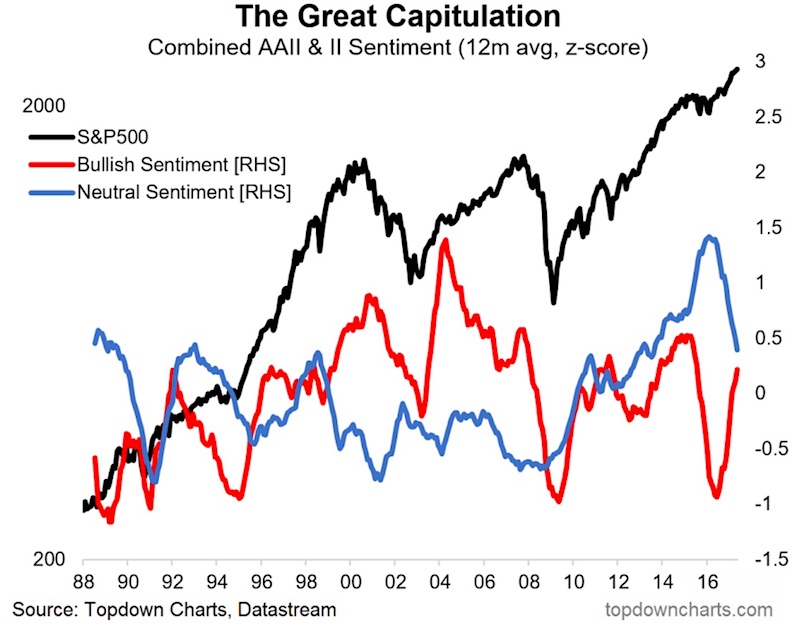
The chart shows a great capitulation by those in the “neutral” camp as investors who’ve either sat on the fence or sat on the sidelines have quickly moved over to the bullish side. The graphic also shows the move higher in the S&P 500 Index (INDEXSP:.INX).
As noted, we’ve seen this kind of capitulation and transition to bullishness before. I’ll leave you to look at the chart to find it, but I’ll give you a hint – valuations were similar then to what they are now.
As for the mechanics of the chart. It’s the bullish and neutral sentiment readings from the II and AAII surveys. A z-score was used to normalize the series and put them on a comparable basis, and a 12-month moving average was used to smooth the series in order to capture the trends.
While there were a couple of other instances where there was a transition from high neutral readings to high bullish readings, the one that stands out to me is that which occurred toward the peak of the dot-com equities boom where it went full circle and neutrals flipped extremely bullish.
Will history repeat? Perhaps, but consider these 2 points: 1. there hasn’t been a crossover yet; and 2. the extreme neutral readings we saw in 2016 were unprecedented. That’s what makes charts like this so fascinating, thought provoking, and special. It also makes this chart one to keep on your radar, and I will be keeping it front of mind for my clients.
Twitter: @Callum_Thomas
Any opinions expressed herein are solely those of the author, and do not in any way represent the views or opinions of any other person or entity.


