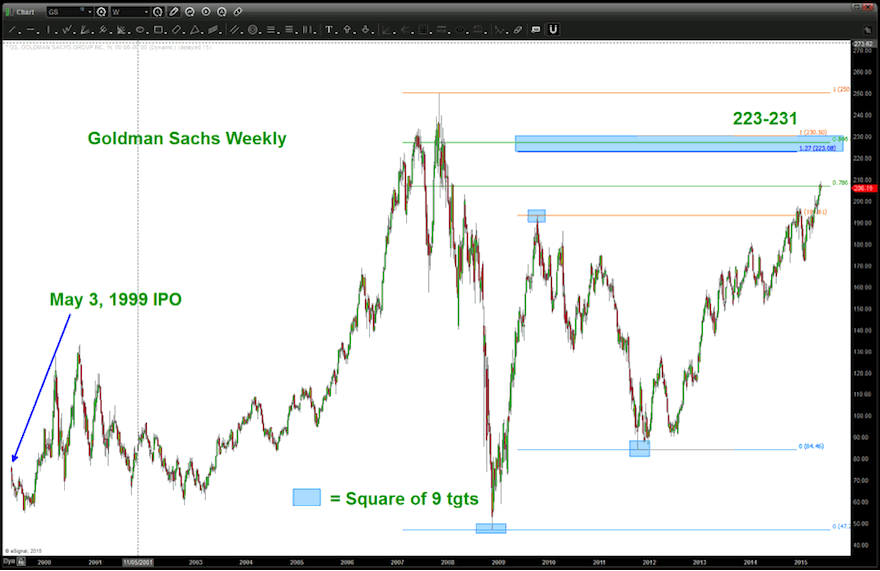
One could argue Goldman Sachs (GS) is one of the most important financial institutions on the planet for a myriad of reasons. So, writing about a potential SELL PATTERN that is present is probably not well advised. Well, as a pure play pattern recognition chartist, here’s the SELL PATTERN present on Goldman Sachs Stock.
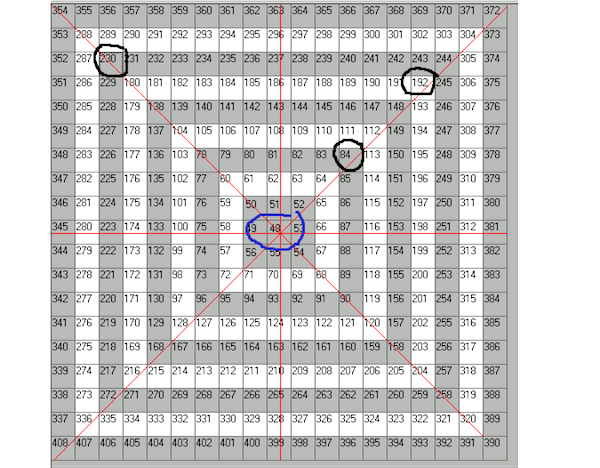
Note, we are finding resistance at the .786 retracement from the old all-time highs most recently. This could trigger a pullback over the near-term. But if you look a little higher you will see a bunch of other numbers that come into play as well (offering additional resistance). I’m inclined to watch that convergence area for pattern completion (around 223-231).
Goldman Sachs Stock Chart 2000-2015 (monthly bars)
GS Square Of 9
Goldman Sachs Stock Charts – Weekly Bars With Square Of 9 Price Targets
As always, let me know if you have any questions and thanks for reading!
Twitter: @BartsCharts
No position in any of the mentioned securities at the time of publication. Any opinions expressed herein are solely those of the author, and do not in any way represent the views or opinions of any other person or entity.


