Global PMI Rebound on the Cards?
One key feature of the last 15 months has been the consistent declines in the global manufacturing PMI.
After peaking in December 2017, the global manufacturing PMI has undergone a major slowdown, and that was a key driver behind the weakness in global markets last year (and a reflection of stimulus withdrawal).
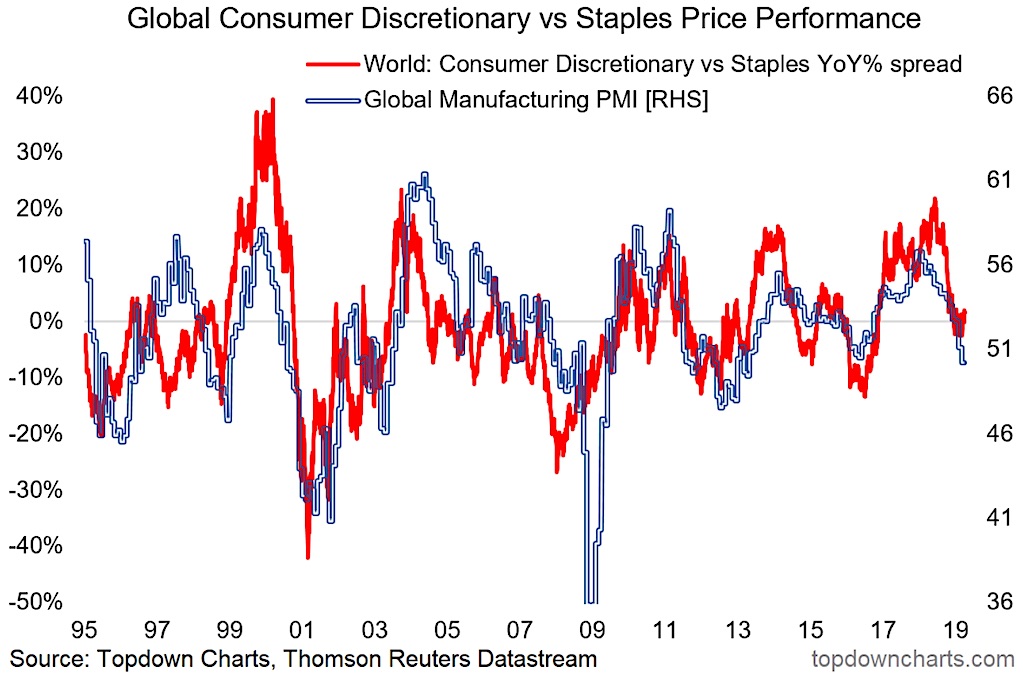
But as the chart below from the latest Weekly Macro Themes report shows, this global growth slowdown could soon be over…
The chart shows the return differential between global consumer discretionaries and consumer staples against the global manufacturing PMI.
As you can see there has been a slight rebound in the performance differential.

This chart is one of the increasing number of “green shoots” on the global growth outlook we’re seeing. And while it’s certainly true that we will need to see some follow-through in the red line to confirm this view, the fact that it’s already begun diverging to the upside against the global PMI is indeed a promising sign.
So what’s behind this and the other so-called “green shoots”?
There’s a few things at play, first is simply the washing out of some of the major previous headwinds e.g. the trade war arguably has already unleashed its maximum damage on the global economy (that is, the impact is not getting incrementally worse).
The other big thing is the policy pivot. In America the Fed has opted to taper QT and put rate hikes on ice, elsewhere around the globe we’ve seen a lurch to the dovish side, and the composite shadow policy rate for developed markets has fallen about 50bps since peaking in November last year.
China is also a key factor, and the steady yet measured series of stimulus actions appear to have started to have an impact on stemming the slowdown (e.g. the March China PMIs were much better than expected).
So there’s a few things happening to turn the tides…
As to why this matters, my view has been that the key determinant of how risk assets perform this year is going to depend on whether the slowdown is the start of a global recession or simply a passing growth scare. Today’s chart provides some evidence for the latter.
Twitter: @Callum_Thomas
Any opinions expressed herein are solely those of the author, and do not in any way represent the views or opinions of any other person or entity.


