 By Andrew Nyquist
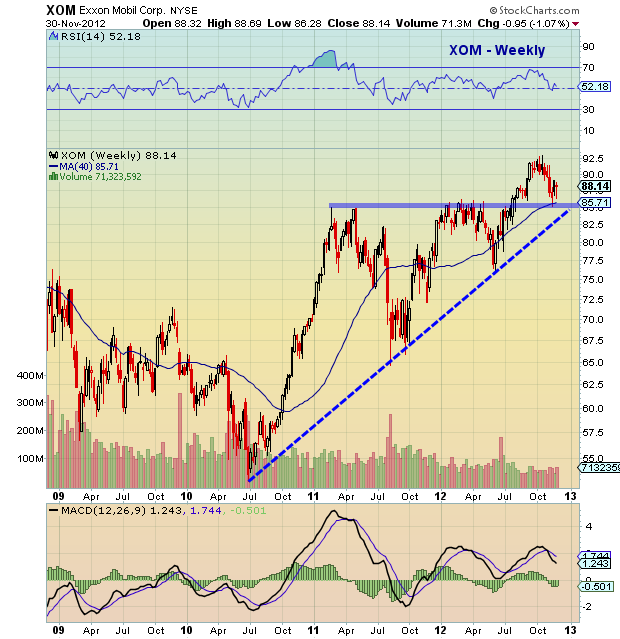
Since I last covered the Exxon Mobil (XOM) breakout back in September, the stock has pulled in, retesting the breakout level around $85. To be exact, the low of this pullback is $85.06, marking a 50 percent retracement of the June low to September high. No doubt, it would be ideal (and bullish) for this level to hold.
However, not all breakouts are created equal. And because of this, we want to watch the breakout area closely to see if it offers support and validation. In short, the current pullback is what technicians and chartists call a backtest. I like to think of a backtest as a collective test of investor psychology. Afterall, price is a psychological reflection of what we are willing to pay for a given security. To learn more read “Trade Setups: Understanding the Backtest“
In full disclosure (and as mentioned below each article), I do not have a current position in Exxon Mobil – XOM. However, I am monitoring the price action and may give it a closer look near the $86 level. Either way, the uptrend line is converging on the breakout area and looks to offer a good stop level for longs.
Trade safe, trade disciplined.
Exxon Mobil (XOM) stock chart posted December 2, 2012. XOM technical stock breakout chart with support and resistance levels.
———————————————————
Twitter: @andrewnyquist and @seeitmarket Facebook: See It Market
No position in any of the securities mentioned at the time of publication.
Any opinions expressed herein are solely those of the author, and do not in any way represent the views or opinions of his employer or any other person or entity.


