Our investment firm has hosted well over 50 client events since this COVID-19 pandemic-driven recession began. To be clear, these were all virtually hosted from the comfort of our home offices, with attendees in their respective homes.
The downside is that interaction is, well, less interactive. But the upside is that travel time has been cut significantly – merely logging in 10 minutes early. In one day we can be in Toronto, Charlottetown and Calgary for instance. Questions vary from event to event, with the one most common being “how on earth will we ever pay for all of this?”
It is a good question that does not have a clear answer. This seems to align with the uncertainty surrounding the length and duration of this pandemic.
How big is the COVID-19 Economic tab?
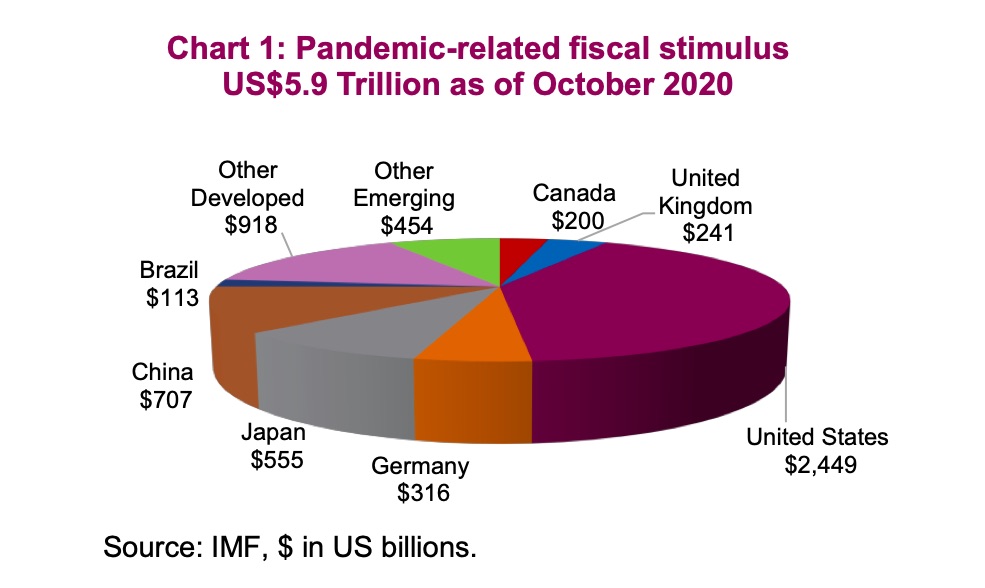
COVID-19 has caused a global recession, reducing government receipts while triggering a policy response that is unprecedented in size and scope. There is no question this has blown a huge hole through most countries’ budget and finances. According to the IMF, the fiscal policy response to COVID-19 has been $5.9 trillion so far (as of October 2020). There has also been $5.8 trillion of liquidity support. Please note for later how close these numbers are.
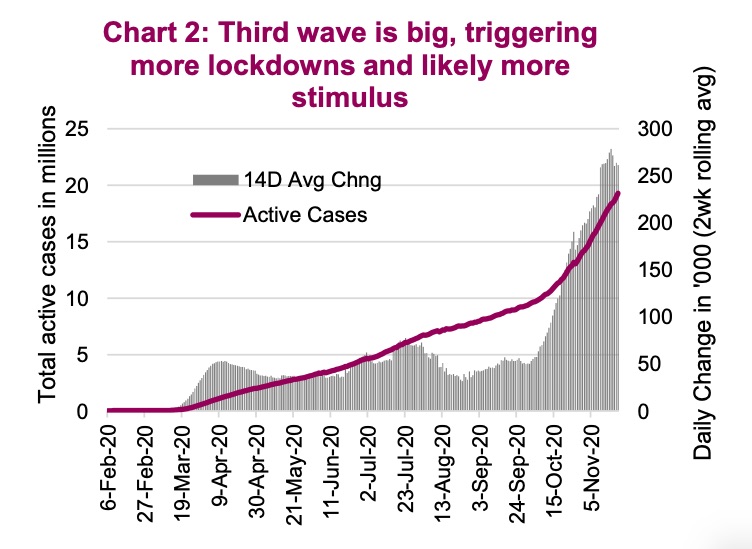
There is no questioning the policy responses are required. This pandemic-driven recession is perhaps the most uneven and unfair in history – severely impacting some industries/workers while leaving others either unscathed or even benefitting. To combat the pandemic, society has been forced to shut down or limit many industries resulting in a combination of higher unemployment and/or wage subsidy requirements. Either way, the cost lands on the government’s budget. And it is far from over. Chart 2 reveals the size of the third wave which is widespread and evident in most nations. This is leading to increased lockdowns which will likely trigger additional stimulus spending to support impacted industries/workers.
The $5.9 trillion October tally of stimulus spending isn’t growing as fast as it did in the initial months, but it is still growing. It is well beyond our ability to forecast the end number but a rough guess of $8 trillion seems pretty plausible before a vaccine becomes available and things get back to the new normal. A hefty tab no doubt.
Financing stimulus
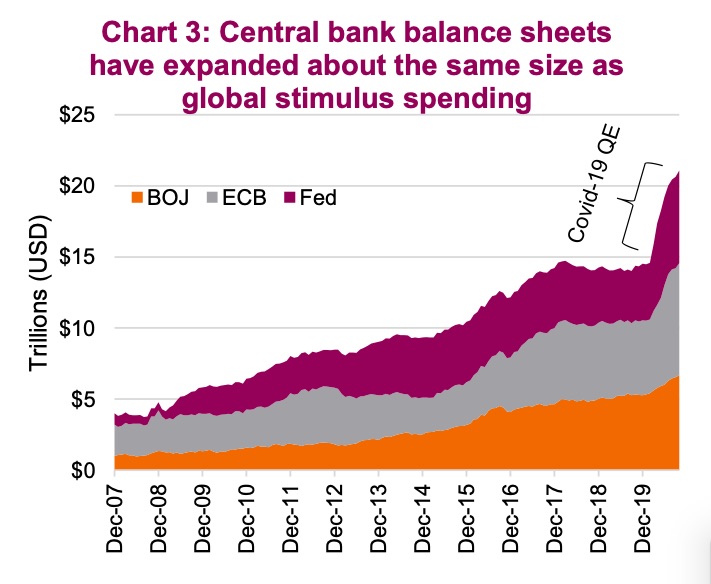
If the governments of the world simply issued bonds to finance the cost of the pandemic stimulus, we would quickly see higher bond yields. The size of the debt issuances would likely surpass investor demand, and require higher yields to entice more investors to partake. This hasn’t happened because central banks have been actively buying bonds, effectively financing the stimulus programs. You will recall the October tally of stimulus spending was roughly the same as liquidity support.
Again, we don’t disagree with this strategy. Society needs the stimulus to support impacted industries as we wait for a vaccine or herd immunity. Without the central banks indirectly financing this spending, bond yields would rise hurting the fragile economic recovery. The UK government indicated it would not be able to fund itself back in March without the Bank of England liquidity support. Others were in a similar situation. So the central banks stepped up.
Problem solved right? Not so fast.
The tab still needs to be paid
The pandemic stimulus has simply been financed by the central banks of the world, which does need to be paid in one fashion or another. However, it is not as straightforward as slowly paying off your visa bill after over- celebrating the holidays. Government balance sheets have taken a hit with much of the increased debt issued being held by their respective central banks. So what happens next is the big question and there are many different scenarios and combinations of scenarios. Here are our thoughts on a few.
Just don’t pay it – The ease of financing this much new debt using the central bank’s balance sheet certainly has some believing we could just keep doing this. Pay the coupons on the bonds, to the central bank/bond holders, and at maturity have the central bank buy a new bond to replace the maturing one.
The risks to this practice include inflation and the loss of credibility for the central bank. Credibility is crucial – just look at any central bank that historically lost its credibility. Finances, currencies, markets quickly suffer. The inflation risk of this approach is real too. Make no mistake, monetary expansion used to fund fiscal spending is very inflationary.
However, the current recession / 10% unemployment is very deflationary. Hence it is more of a risk for the medium term than one for today.
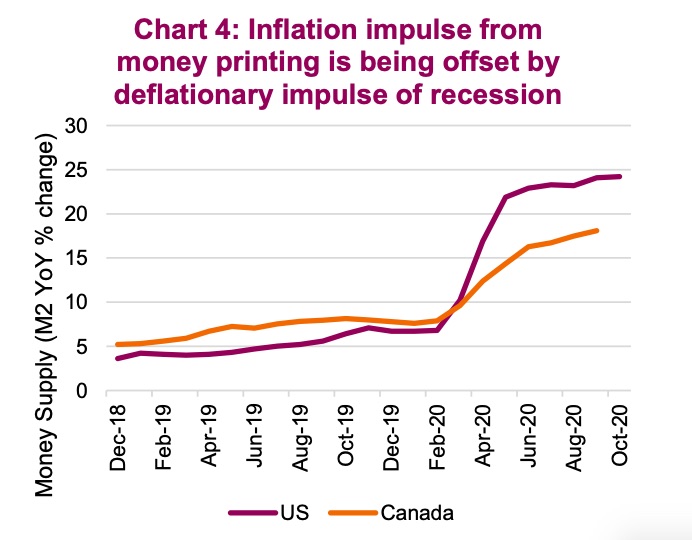
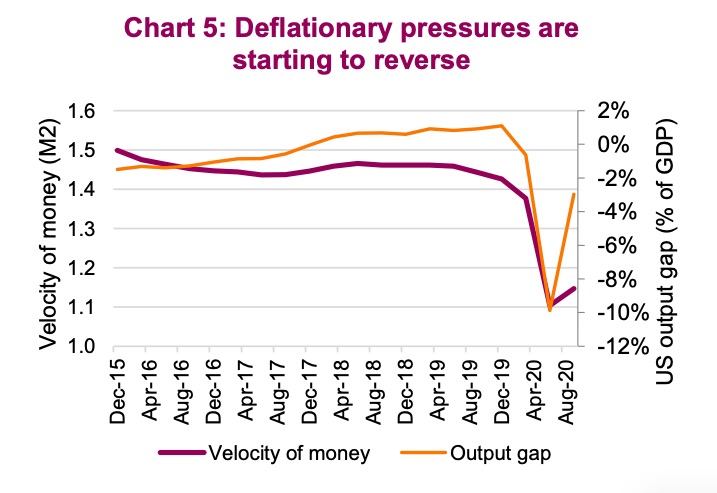
Bloomberg Economics conducted an insightful math exercise. If the velocity of money and the money multiplier were at historical average levels (2017- 2019 average), this monetary expansion/fiscal spending would result in between 30-60% price inflation depending on the country. Don’t worry, that isn’t the case. It is also worth noting that the stimulus spending went to consumer products, again likely less inflationary as it was spending to replace lost income.
However, when inflation starts to appear and the velocity of money starts to normalize, will the pandemic-relief policies (high liquidity) be wound down to alleviate the rising pressures? Chart 5 indicates that some of the deflationary pressure may be starting to wane already. We still remember the so-called taper tantrum of 2013 when the U.S. Federal Reserve indicated plans to start normalizing its balance sheet. Today, the market is also hooked on liquidity and removing it will likely be volatile.
Inflation is one long-term solution to high debt levels and some central banks have indicated higher inflation would be welcome for a period. This would reduce the real debt level. However, inflation is essentially a tax on your spending power. It is much stealthier than raising your income tax rate or a sales tax, but has a similar impact as you can buy/ afford.
Grow out of it – This worked after past major wars that left a pile of new debt behind. If future debt growth can be equal or be less than economic growth, it becomes less of a burden. Initially this may be easier with yields very low. If yields rose (reflecting the high cost of debt), it would become more of an issue.
Hoping for economic growth could work but we continue to remind ourselves that “hope” is rarely an effective strategy.
Increase taxes – Yes, taxes are likely to rise. Then again, we are pretty sure that is what taxes usually do. Individual income tax comprises about 40% of tax receipts in the U.S. and about 50% in Canada. If or when government policies turn to addressing the hole left in the finances by this pandemic, it is likely that tax rates would be a lever. These are unprecedented times which means any change to the tax code could be on the table.
While there has been some talk of taxing primarily the wealthy to pay for much of the stimulus bill, that may have become more difficult. One thing many people have learned during this pandemic is their ability to work remotely has proven rather effective. At the moment, remote is primarily at home or at the cottage, but future remote could be beyond our borders. This pandemic may have made labor much more mobile than before.
Investment implications
Inflationary pressures are likely to rise in the coming months/quarters as the economy gradually (or quickly) gets back to a more normal footing. The magnitude of these pressures will be influenced by policy adjustments along the way. It will continue to be a rather challenging environment to be a central banker/policy maker as these are uncharted waters.
If inflationary pressures do rise, you can bet that nominal yields will rise too. This would be negative for duration and less so for credit exposure among bond holdings. The reason for this is that if inflationary pressure is rising, it means the economy is well on its way back to normal, which would be good for corporate cash flow and earnings.
We may see currencies become more volatile. When everyone is increasing their money supply, perhaps it is a race of who does it the fastest will see their currency exchange rate fall. That being said, the attractiveness of real assets (including gold) in portfolios continues to rise.
We the people inevitably will have to pay the tab. It could be through a mix of taxation, inflation (less spending power), a more debt burdened government (less services), or less effect central banks (diminishing impact of policy). The longer-term effects of initiatives to combat this pandemic will persist long after the virus.
Twitter: @ConnectedWealth
Any opinions expressed herein are solely those of the authors, and do not in any way represent the views or opinions of any other person or entity.


