I believe the SPDR Consumer Discretionary ETF (XLY) may be primed for another short put options strategy.
Last week, the ETF went on to rally 0.6 percent. Thus, the premium earned selling weekly June 26th 77 puts was kept. Could this work again on XLY?
To refresh, in our hypothetical example on June 1, June 5th weekly 76.50 calls were sold for $0.47. At expiration, the calls were in the money by two pennies. Since these were naked calls, the trade effectively went short at $76.97. Then last week, June 26th 77 puts were written for $0.29. Had the ETF dropped below $77, it would have effectively covered the short position for a profit of $0.26. Apparently it did not. The premium thus earned effectively raised the price it was shorted at – to $77.26, from previous $76.97.
The ETF closed at $77.90 on Friday.
Now it is time for traders to decide – again, hypothetically – to cover or do another option trade?
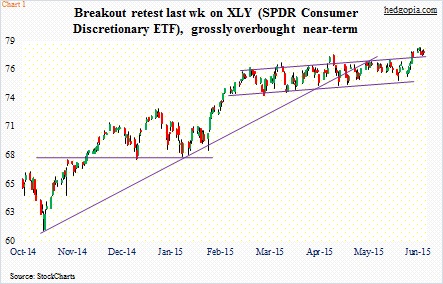
First off, the Consumer Discretionary ETF had a good week. The major U.S. indices – ranging from the S&P 500 Index to the Dow Industrials to the Nasdaq Composite to the Russell 2000 Index – all ended in the red. XLY was in the green. To recall, the ETF broke out of a four-month slightly rising ascending channel seven sessions ago (see chart 1 below). The breakout level was tested during the week, and it held.
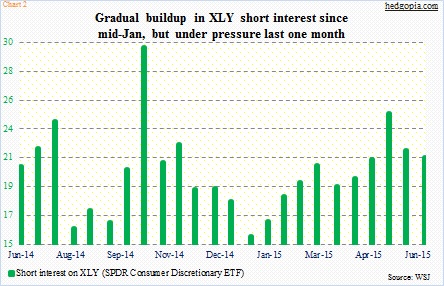
Even before that breakout, shorts were playing it safe. At mid-June, short interest nudged lower period-over-period, to 21.4 million from 21.9 million (see chart 2). Between mid-May and mid-June, the ETF was essentially flat, yet short interest dropped 13 percent. Shorts likely wanted to get out of it before the second-quarter earnings season began.
The earnings bar is low – which by the way is nothing new. This has become routine. Estimates start out high and then get progressively lowered.
Currently, 2016 operating earnings estimates for S&P 500 companies are $132.65, which is nearly $5 lower from four and a half months ago ($137.46 as of February 12th). One year ago, 2015 was expected to bring in $137.52. Those estimates have now been slashed to $115.64. Second-quarter estimates are $28.46, versus $33.73 at the end of June last year.
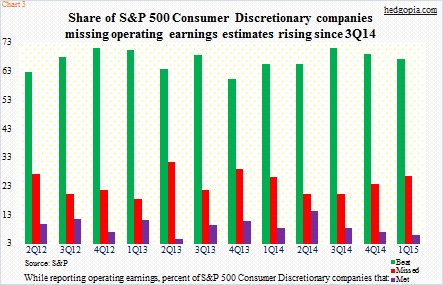
The point is, expectations have been chopped left and right – just in time so companies can beat/meet. Therein lies the rub. Just because the bar is low, companies do not necessarily hit it out of the park. Take a look at chart 3 below.
It lays out what percentage of S&P 500 Consumer Discretionary companies beat, missed or met operating earnings estimates going back 12 quarters. The share of those in the missed category has steadily gone up since 3Q14. Nonetheless, XLY has noticeably rallied during the period.
Given this, not knowing how earnings will come in and/or – more importantly – how markets will react to these earnings, it is probably not a bad idea to be thinking to cover. But not before generating some extra income. Medium-term, the case to stay short remains strong.
July 2nd 77 puts bring $0.26. If XLY rallies or trades water this week, the short price effectively will have risen to $77.52, from $77.26. If it drops below $77, it is a long at $77, effectively covering the short position, for a profit $0.52.
As things stand now, the risk in the very near-term is that the short put gets assigned. On a daily chart, the ETF is grossly overbought, and near the upper Bollinger Band. A test of the lower bound of the channel it is in (Chart 1 up above) is entirely possible. By the way, that level approximates the 50-day moving average ($76.41).
Thanks for reading!
Twitter: @hedgopia
No position in any of the mentioned securities at the time of publication. Any opinions expressed herein are solely those of the author, and do not in any way represent the views or opinions of any other person or entity.


