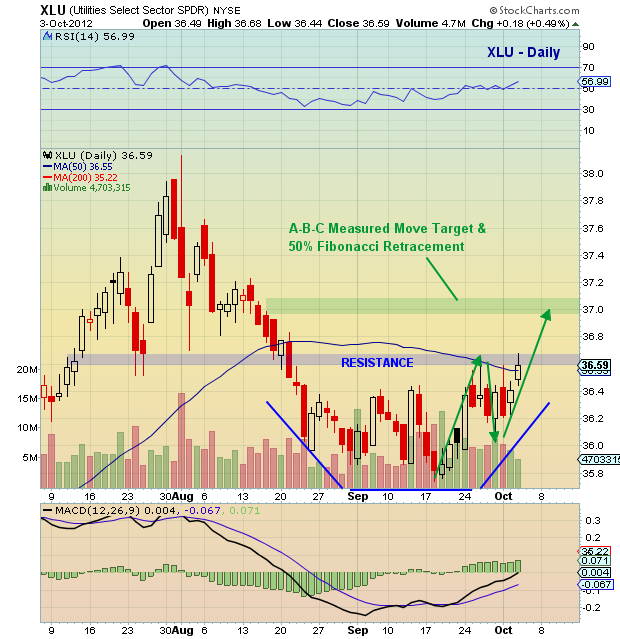
 As the market peaks its head up near the top of the two week range, the Utilities Sector (XLU) is outperforming. And this typically is not a bullish near term indicator for equity markets.
Looking at the chart below, it’s clear that the XLU has formed a nice base from which to extend higher. Provided that it sustains a break through $36.65, the XLU should push to and above $37.00.
Trade safe, trade disciplined.
More charts found here.
Utilities (XLU) chart as of October 3, 2012. XLU price chart with Fibonacci retracements and price targets. XLU technical analysis.
———————————————————
Twitter: @andrewnyquist and @seeitmarket Facebook: See It Market
No position in any of the securities mentioned at the time of publication.
Any opinions expressed herein are solely those of the author, and do not in any way represent the views or opinions of his employer or any other person or entity.


