 By Andrew Nyquist
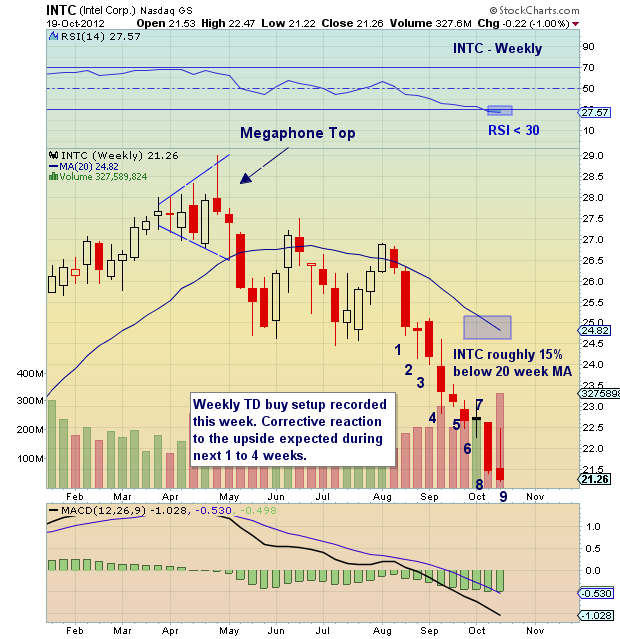
Without a doubt, technology stocks have been leading the market lower of late. And within the technology arena, semiconductors have been particularly weak. Take Intel Corp (INTC) for instance. The big tech titan is trading fifteen percent below its 20 week moving average and down almost 30 percent from the Spring highs.
Granted, PC’s are getting some gray hair and there is some uncertainty here, but I am a technical swing trader. So I’m not going to make a huge fundamental pitch here (although one likely can be made).
My sole interest in Intel stock is for a swing trade. On Friday, INTC recorded a perfected weekly DeMark buy set up 9, increasing the probability of a corrective bounce higher sometime over the next four weeks. Note that the chart below is a weekly chart, so it requires a wider lens for analysis, and maybe a bit more patience, as oversold can remain oversold longer than one thinks.
I built a 1/3 size starter position during the intense selling Thursday and Friday for an average price of 21.54. I will look to add on further downside towards $20, with a stop just beneath the $20 level.
Trade safe, trade disciplined.
More charts found here.
Intel Corp (INTC) stock chart with technical analysis as of October 19, 2012. INTC DeMark weekly buy setup 9 with support levels.
———————————————————
Twitter: @andrewnyquist and @seeitmarket Facebook: See It Market
Author has a position in Intel (INTC) stock at the time of publication.
Any opinions expressed herein are solely those of the author, and do not in any way represent the views or opinions of his employer or any other person or entity.


