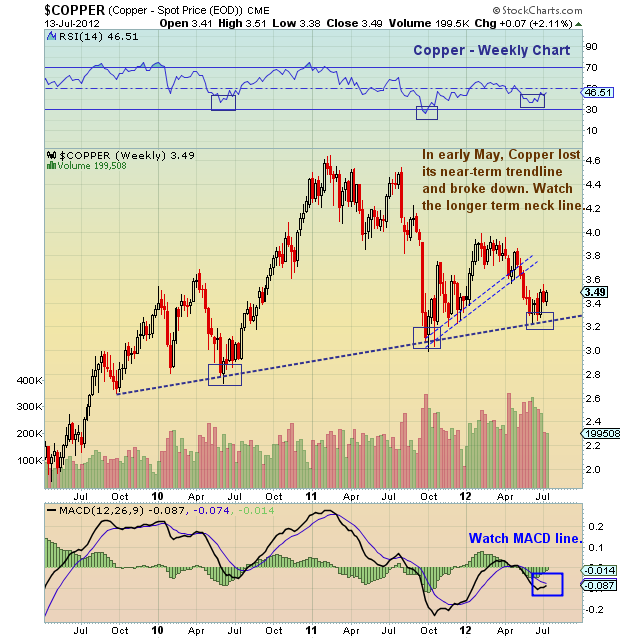
 Copper prices broke down in early May, forming a right shoulder to a possible three year head and shoulders pattern. In short, it would be very bearish if copper prices were to break below the neckline. Furthermore, this would be an ominous sign for the global economy.
But no need for over concern just yet. For now, Copper is almost 10 percent above neckline support. And remember, this is support until proven otherwise. For more charts on [precious] metals, click here.
Copper price chart with support and resistance, trend lines, and price analysis as of July 15, 2012.
———————————————————
Twitter: @andrewnyquist and @seeitmarket Facebook: See It Market
No position in any of the securities mentioned at the time of publication.
Any opinions expressed herein are solely those of the author, and do not in any way represent the views or opinions of his employer or any other person or entity.


